[Gauntlet] Weekly Market Update - (2024-02-02 through 2024-02-08)
Gauntlet would like to provide the community with an update on this market over the previous week. Gauntlet is continuing to monitor this market. At this time, we do not recommend any parameter updates, but will keep the community informed.
Summary
This table gives high-level statistics over the time frame in question. Bold lines correspond to weekly average supply cap usage over 75%.
[Gauntlet] Weekly Market Update - (2024-02-09 through 2024-02-15)
Gauntlet would like to provide the community with an update on this market over the previous week. Gauntlet is continuing to monitor this market. At this time, we do not recommend any parameter updates, but will keep the community informed.
Summary
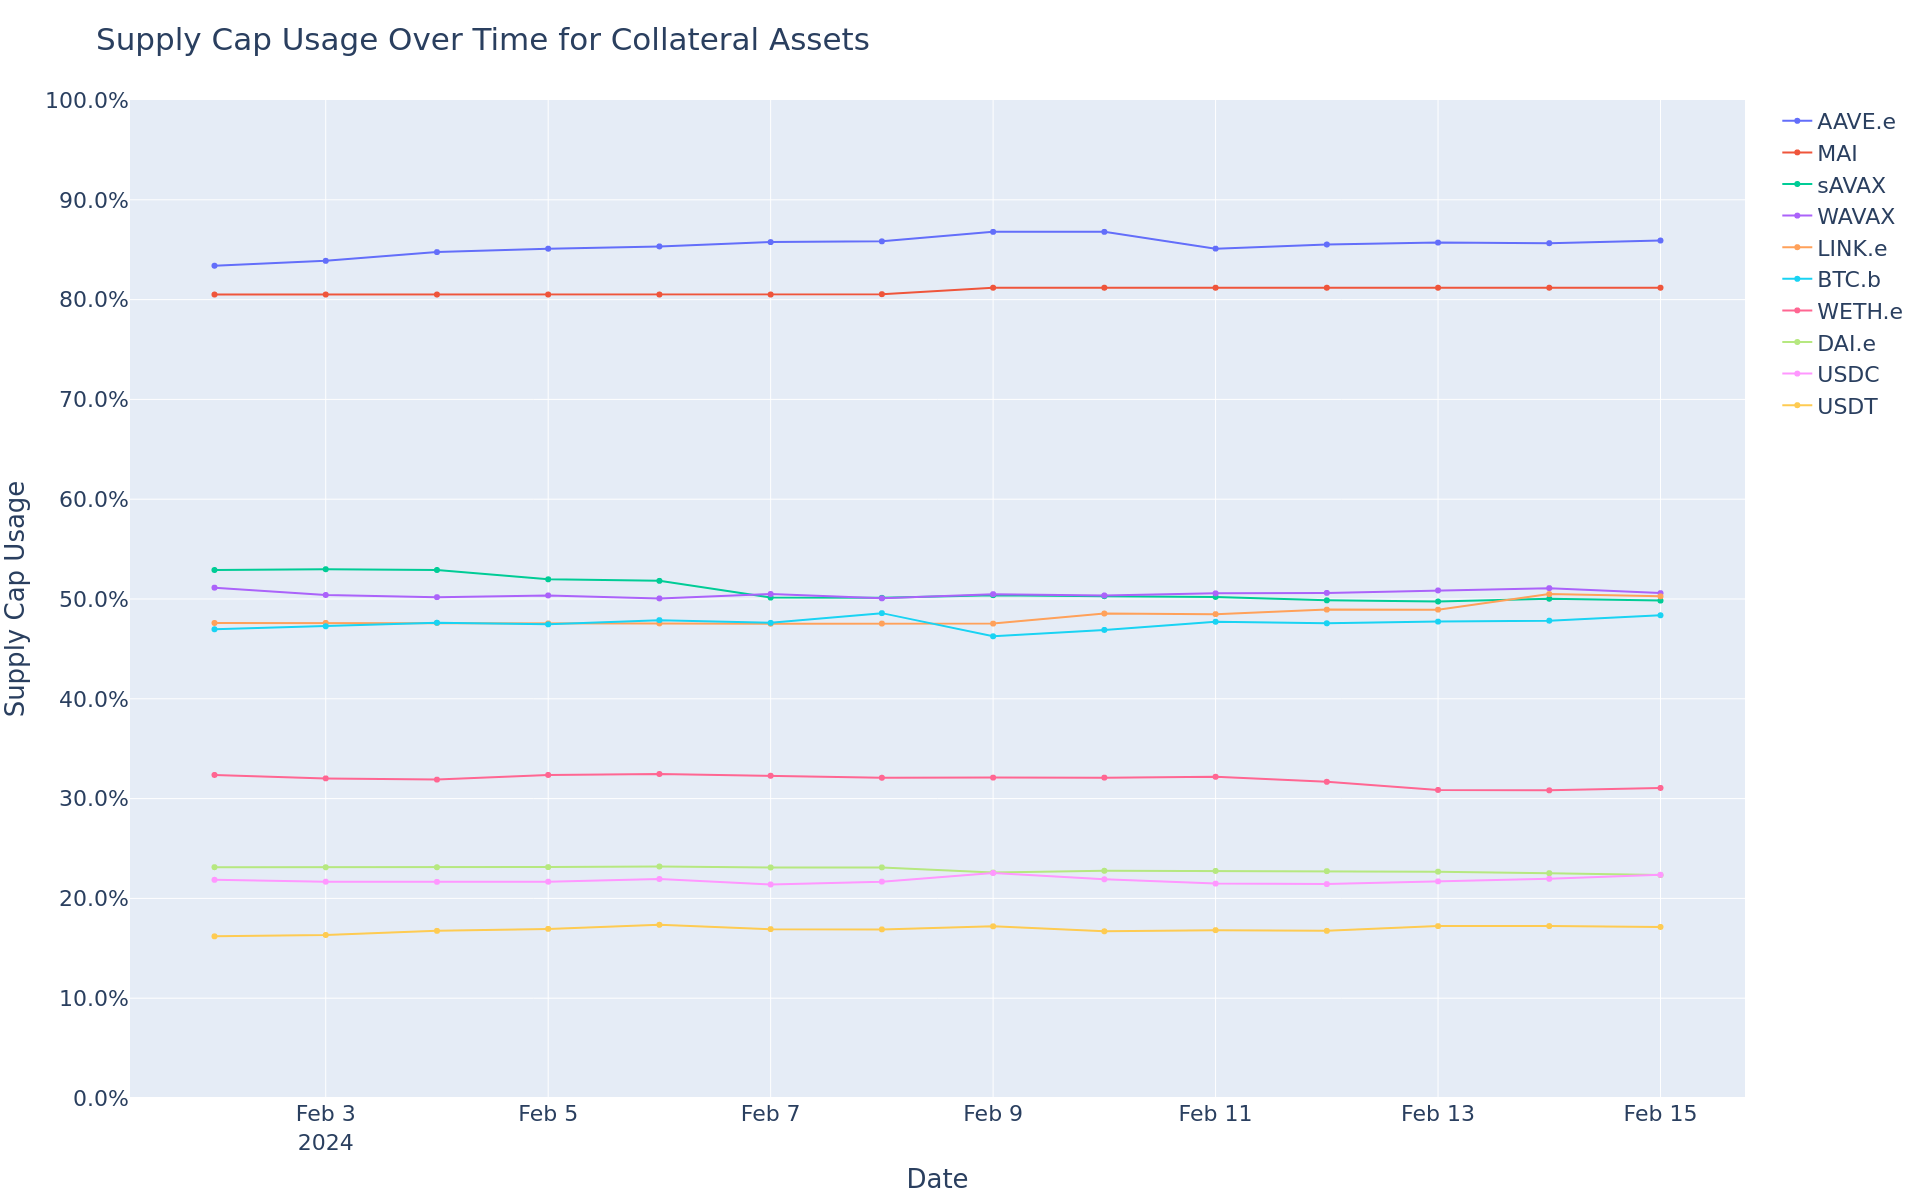
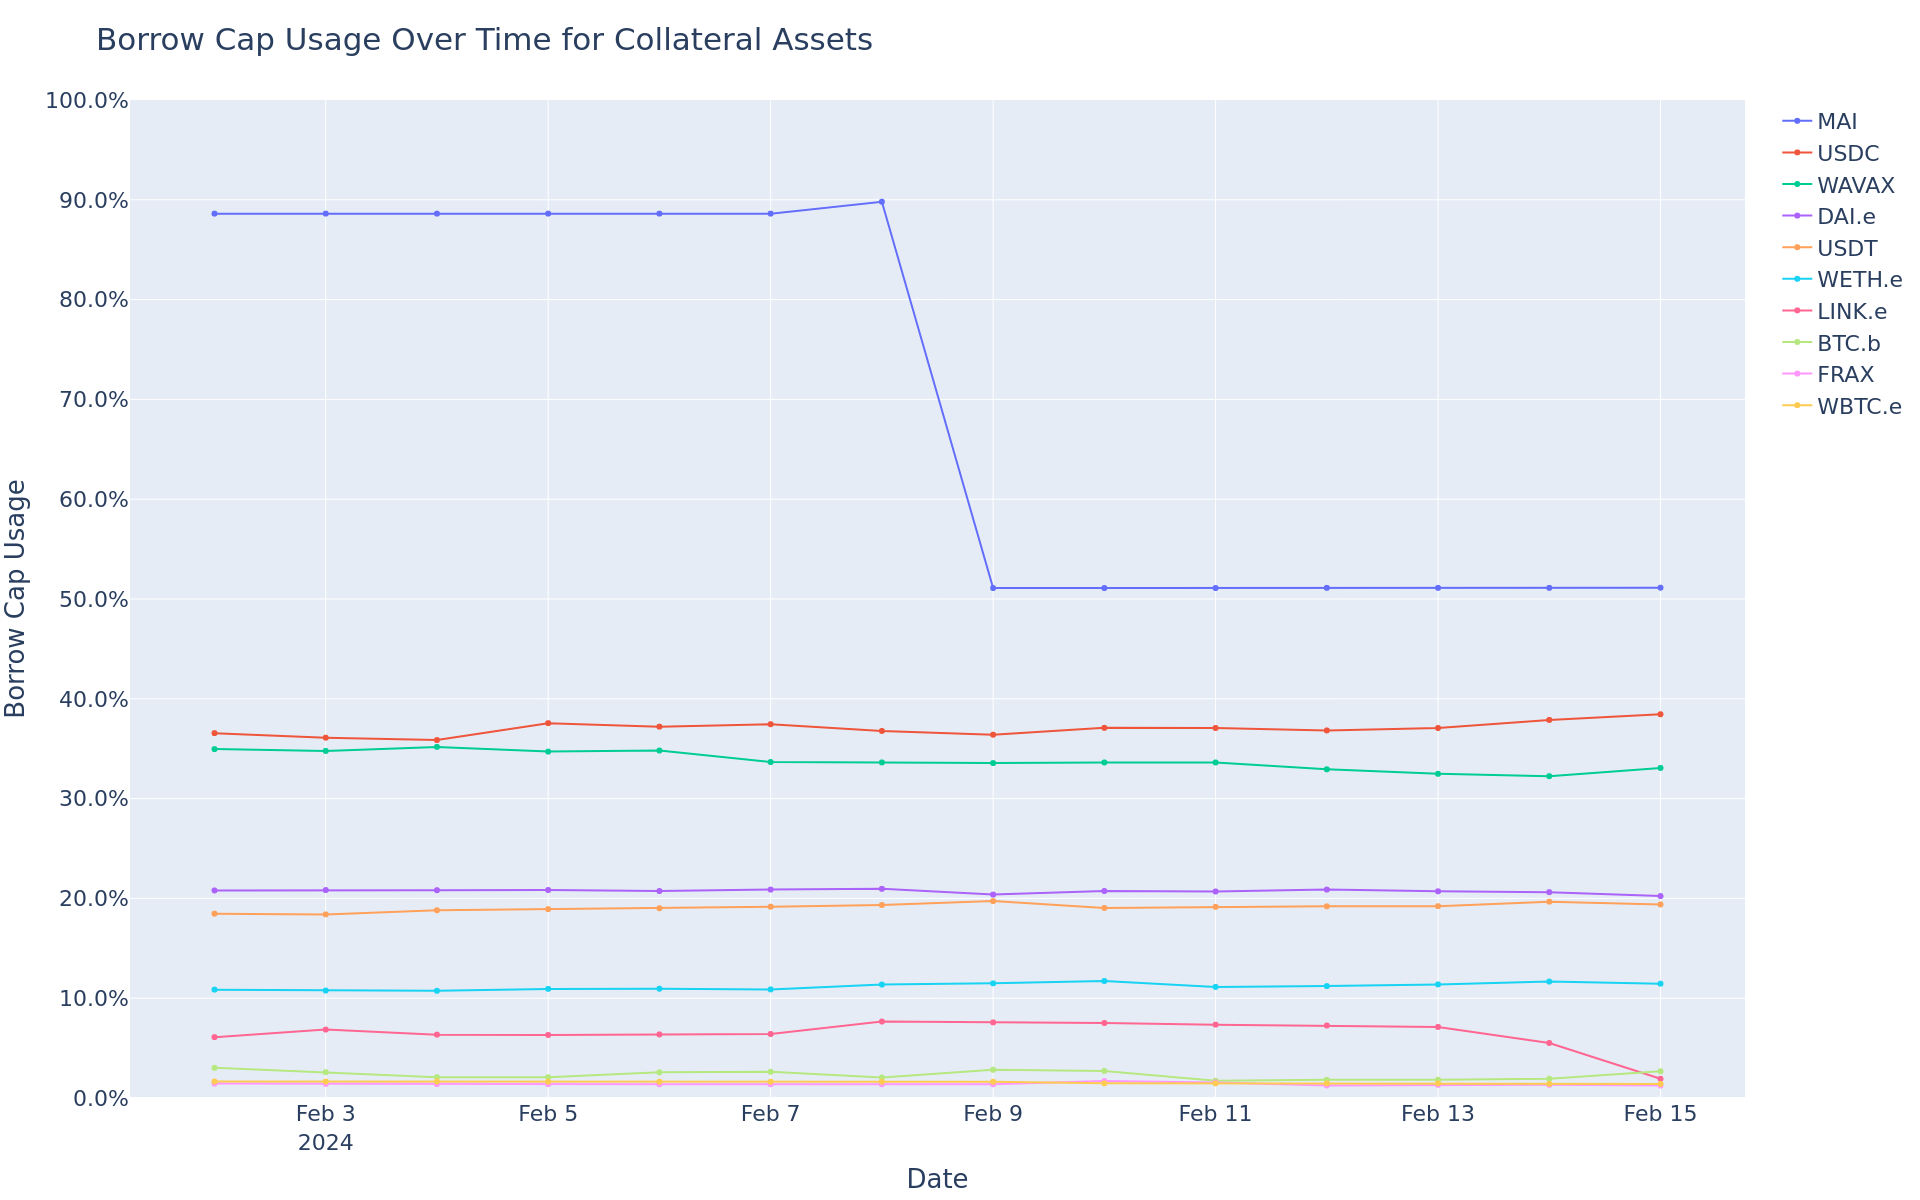
This table gives high-level statistics over the time frame in question. Bold lines correspond to weekly average supply/borrow cap usage over 75%.
Asset
Current Borrow Cap
Current Supply Cap
Average Borrow Cap Usage (Past Week)
Average Supply Cap Usage (Past Week)
Average Utilization
Current DEX 25% Slippage (USD)
USDC
90.00M
170.00M
37.26%
21.91%
90.01%
$947.86K
USDT
80.00M
100.00M
19.35%
17.01%
90.99%
$6.25M
DAI.e
17.00M
17.00M
20.61%
22.63%
91.09%
$636.53K
WAVAX
3.60M
5.70M
33.08%
50.65%
41.24%
$959.09K
FRAX
1.00M
1.50M
1.40%
1.05%
88.69%
$91.47K
LINK.e
220.00K
440.00K
6.32%
49.03%
6.45%
$154.02K
WETH.e
20.50K
38.00K
11.44%
31.55%
19.56%
$912.46K
BTC.b
900.00
3.00K
2.22%
47.48%
1.40%
$920.29K
Top Movers
BTC.b’s borrow balance increased WoW by 50% from $836K to $1M.
LINK.e’s borrow balance decreased WoW by -73% from $308K to $85K.
WAVAX’s supply balance increased WoW by 19% from $101M to $120M.
FRAX’s supply balance decreased WoW by -5% from $15K to $14K.
BTC.b’s utilization increased WoW by 31% from 1% to 2%.
LINK.e’s utilization decreased WoW by -76% from 8% to 2%.
Key Interest Rates
Liquidations
Liquidated Asset
Liquidated Amount (Tokens)
Liquidated Amount (USD)
USDC
17.84K
$17.84K
DAI
4.40K
$4.40K
BTC.B
0.02
$1.08K
WBTC
0.01
$747.10
WETH
0.01
$37.10
WAVAX
0.48
$19.30
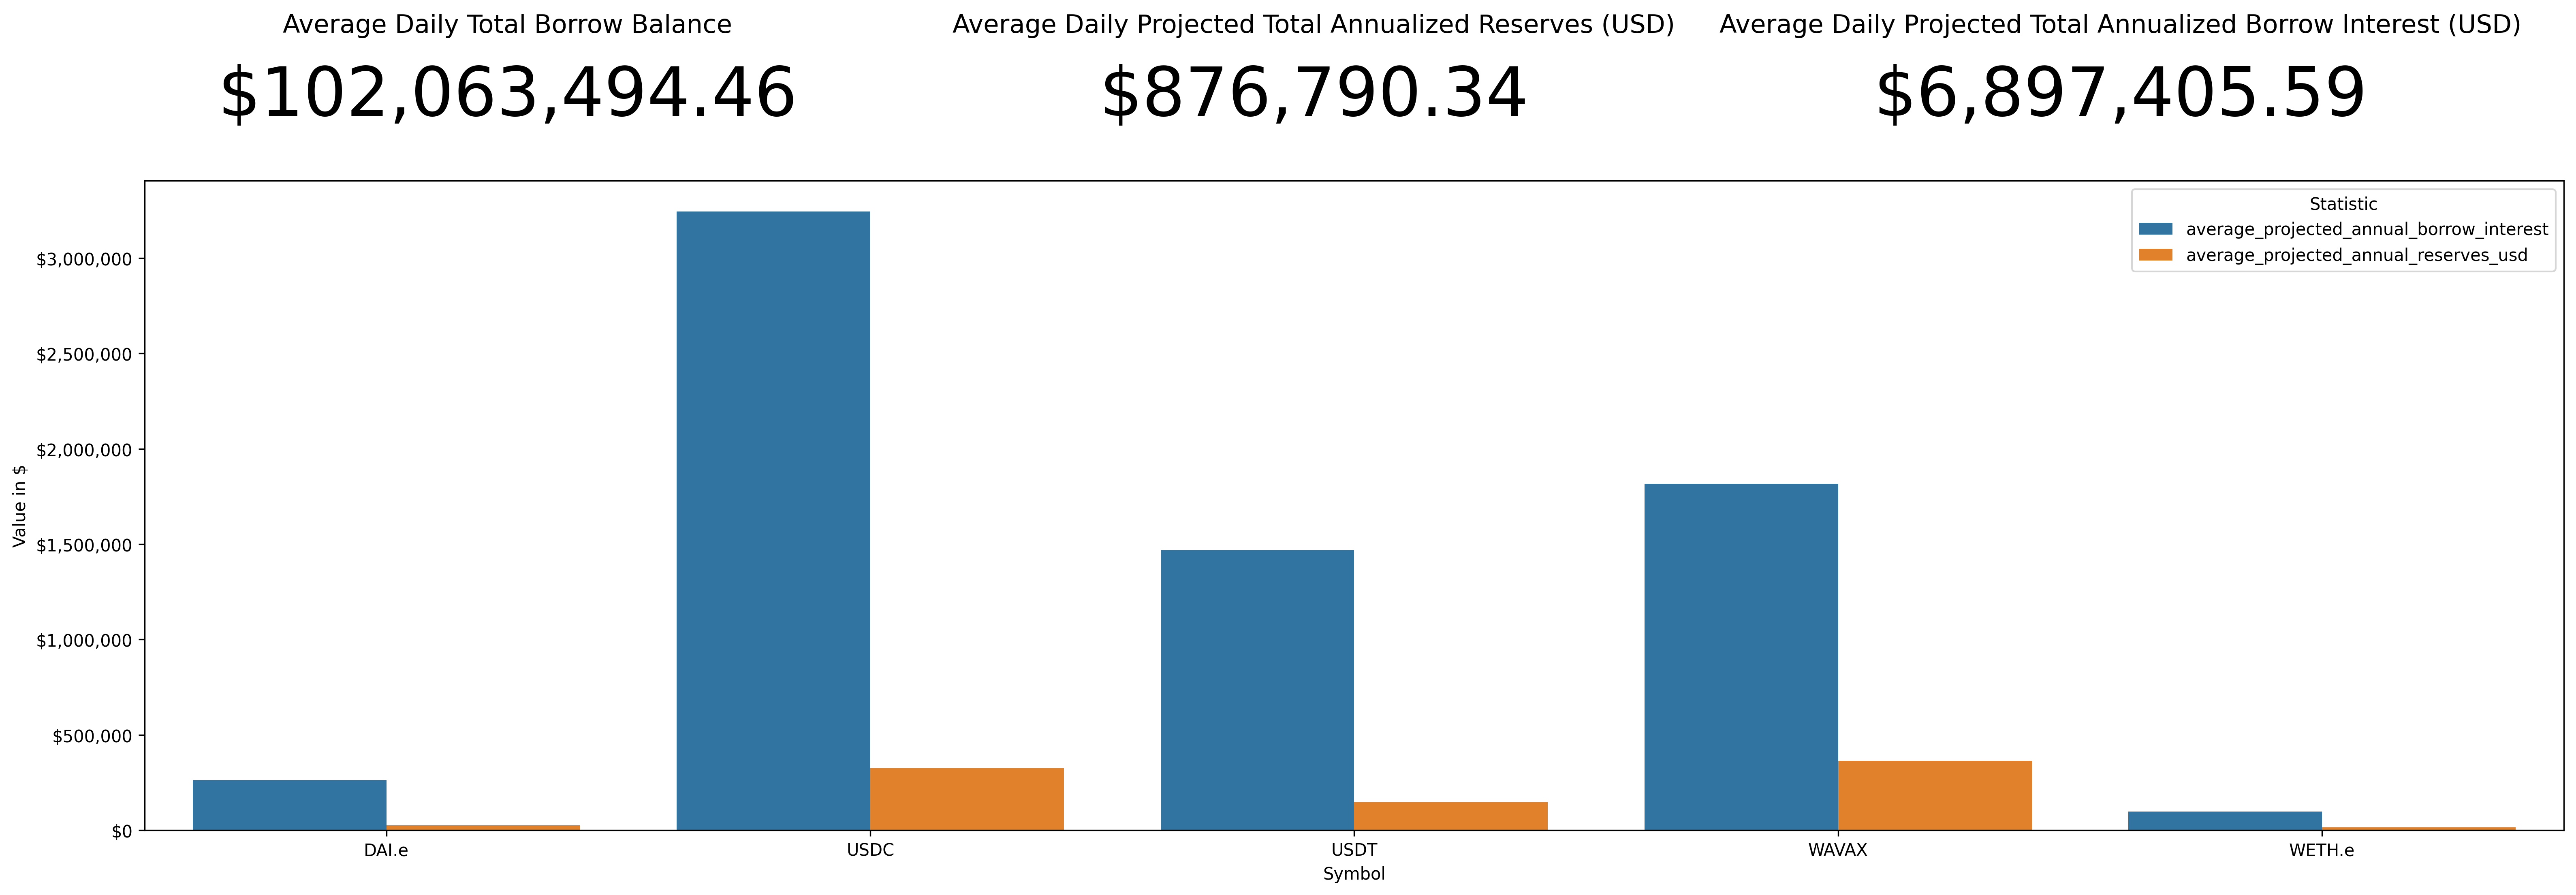
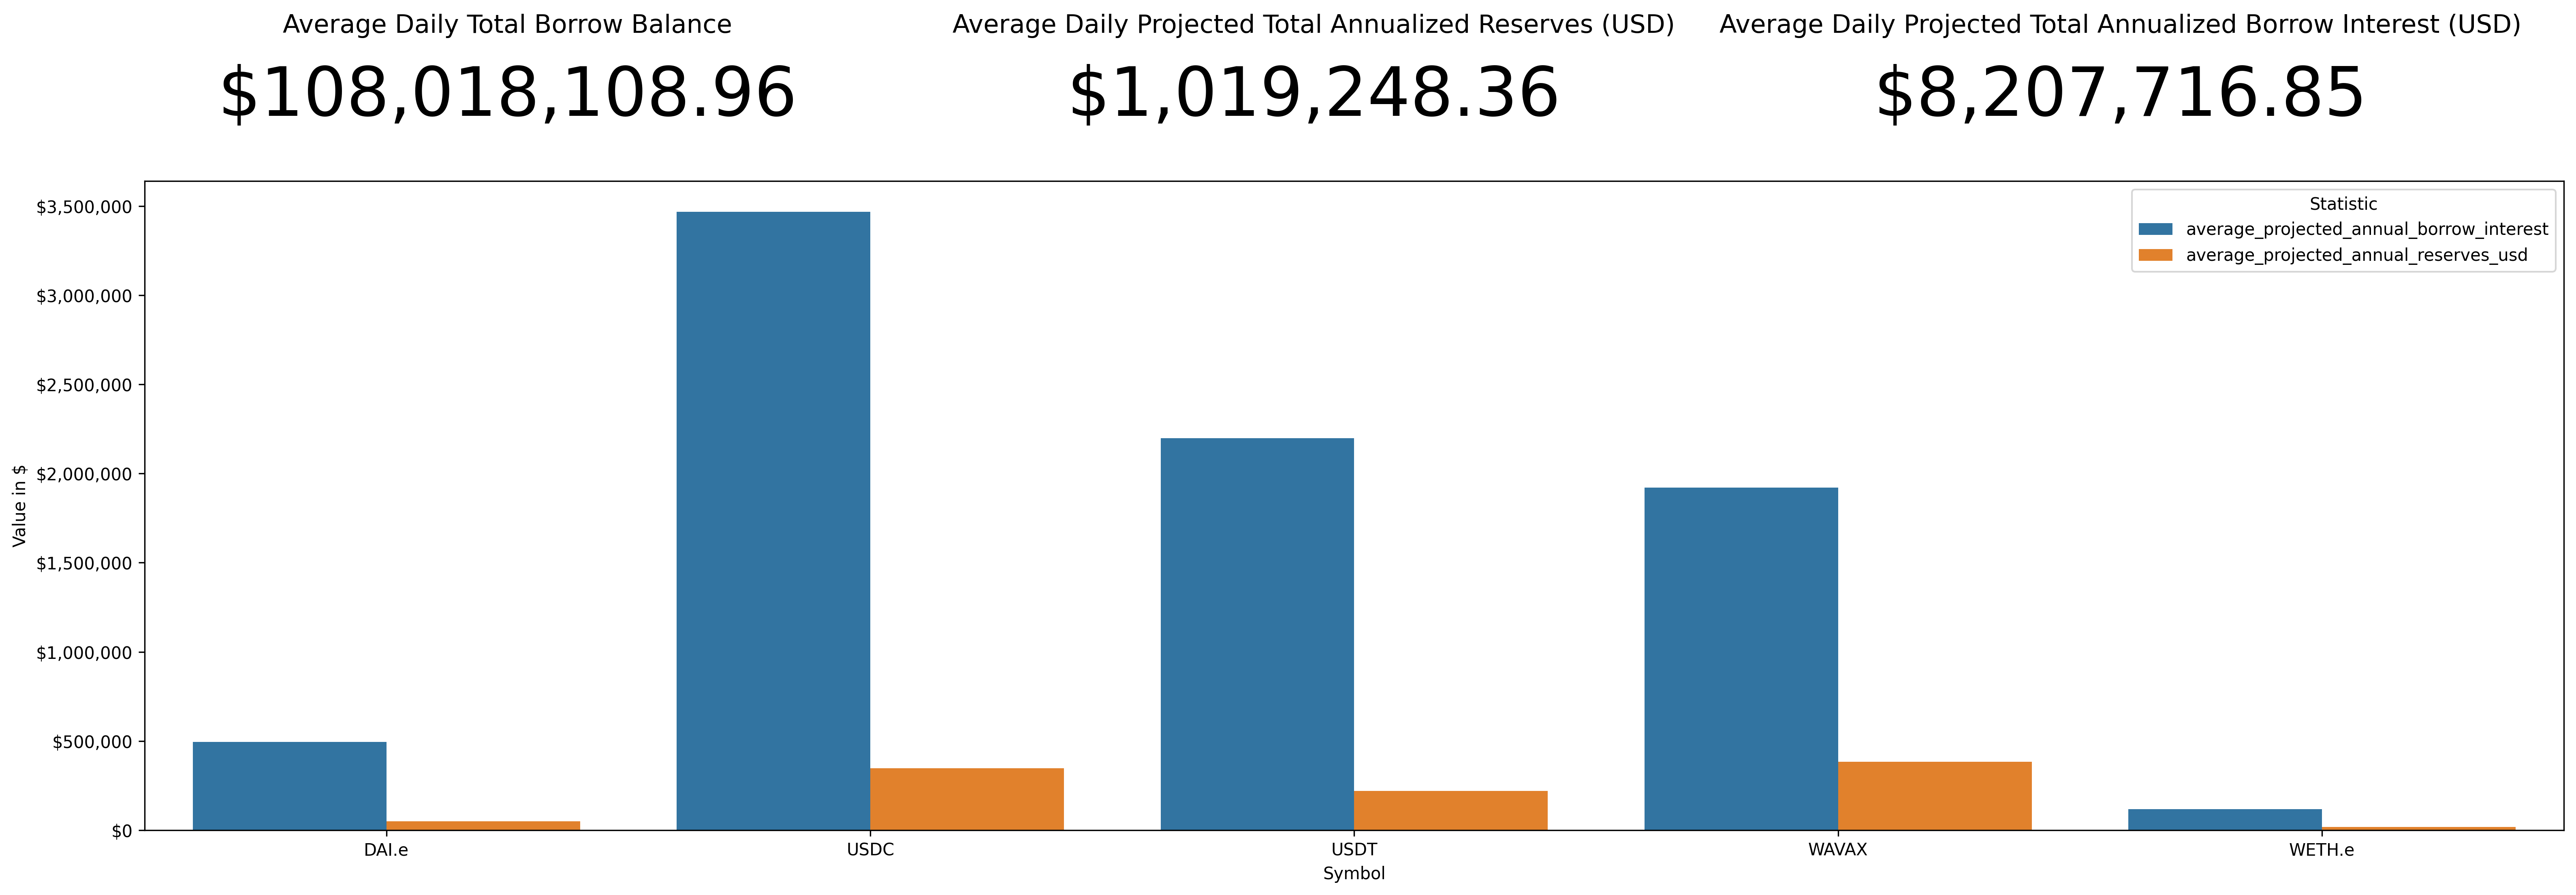
Weekly Annualized Reserve and Interest Projections
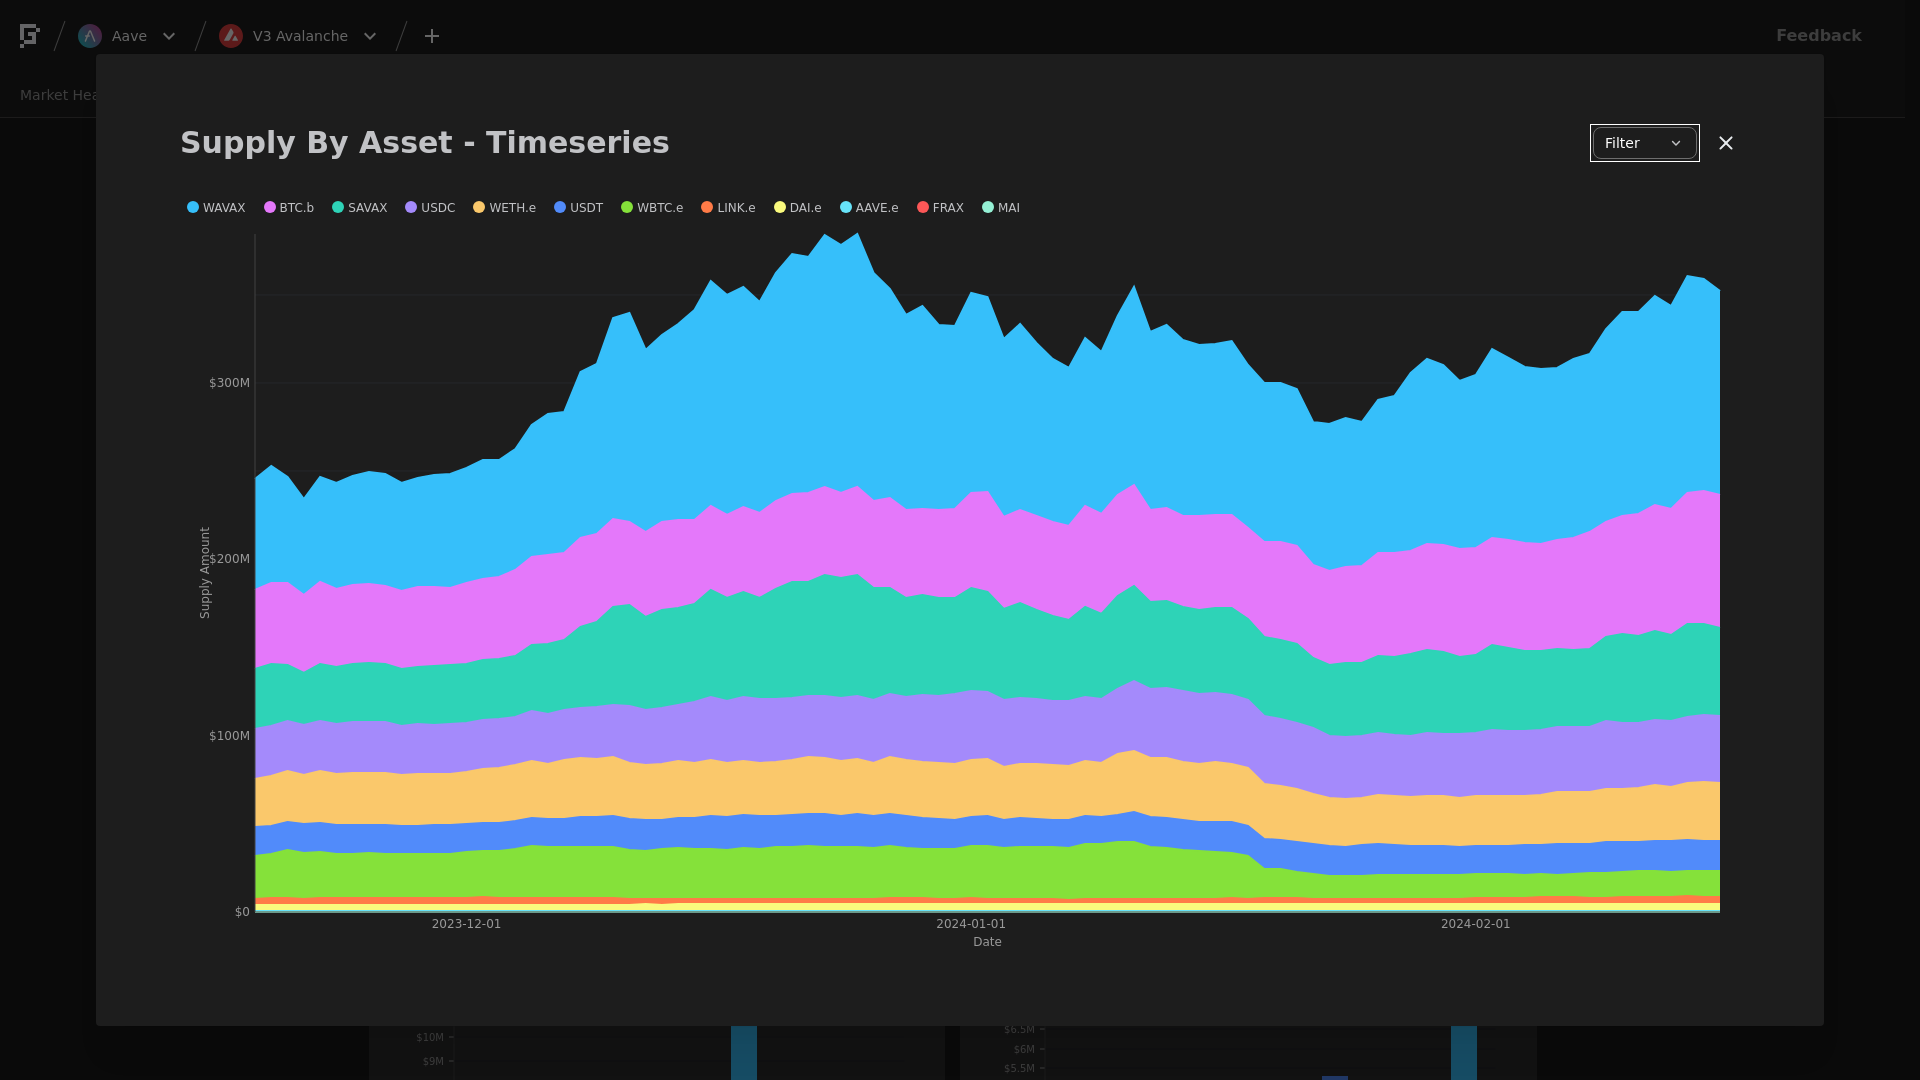
Supply Trend
This graph shows the total supply of all assets over the time frame in question. To see updated statistics, please see the live version of this graph here.
Borrows Trend
This graph shows the total borrows of all assets over the time frame in question. To see updated statistics, please see the live version of this graph here.
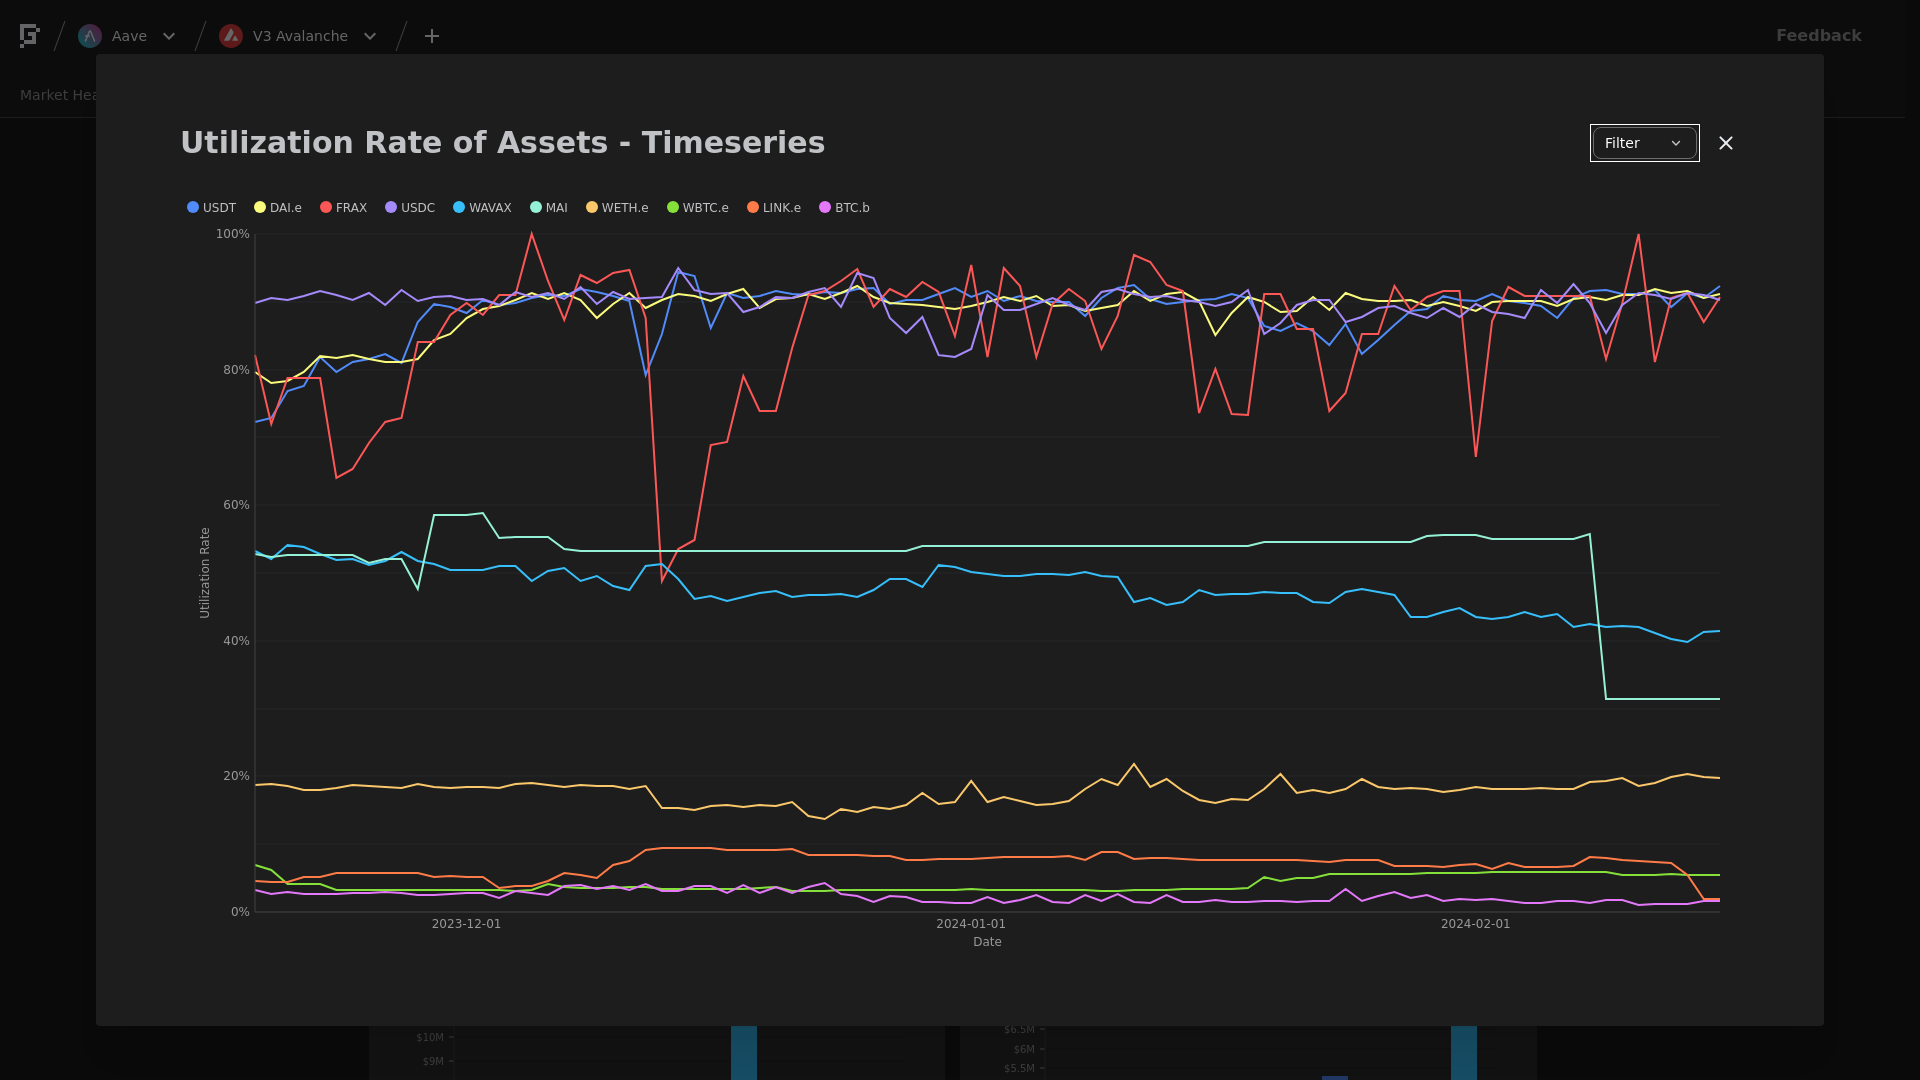
Utilization Trend
This graph shows the utilization (borrow / supply) of all assets over the time frame in question.
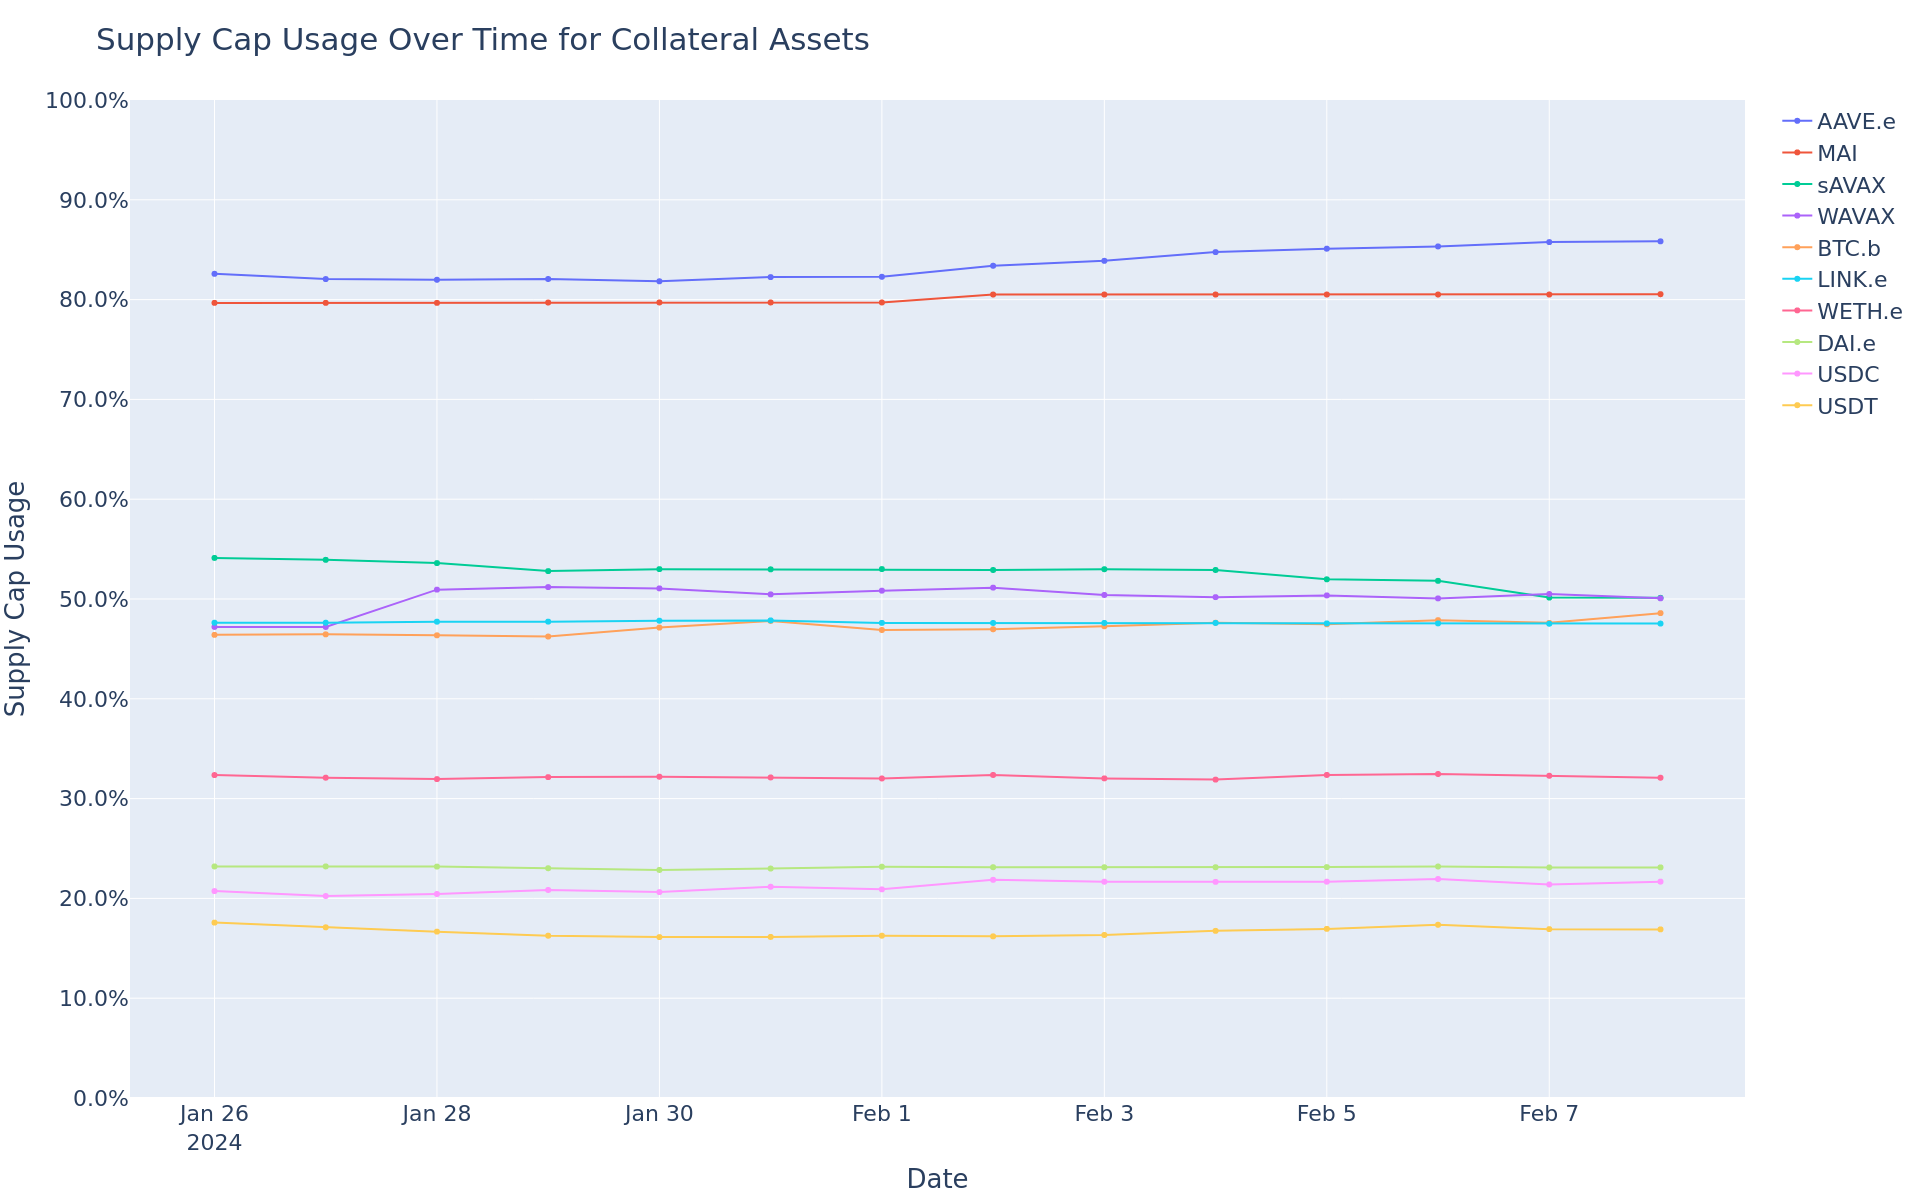
Supply Cap Usage Trend
This graph shows the supply cap usage (supply / supply cap) of all assets over the time frame in question.
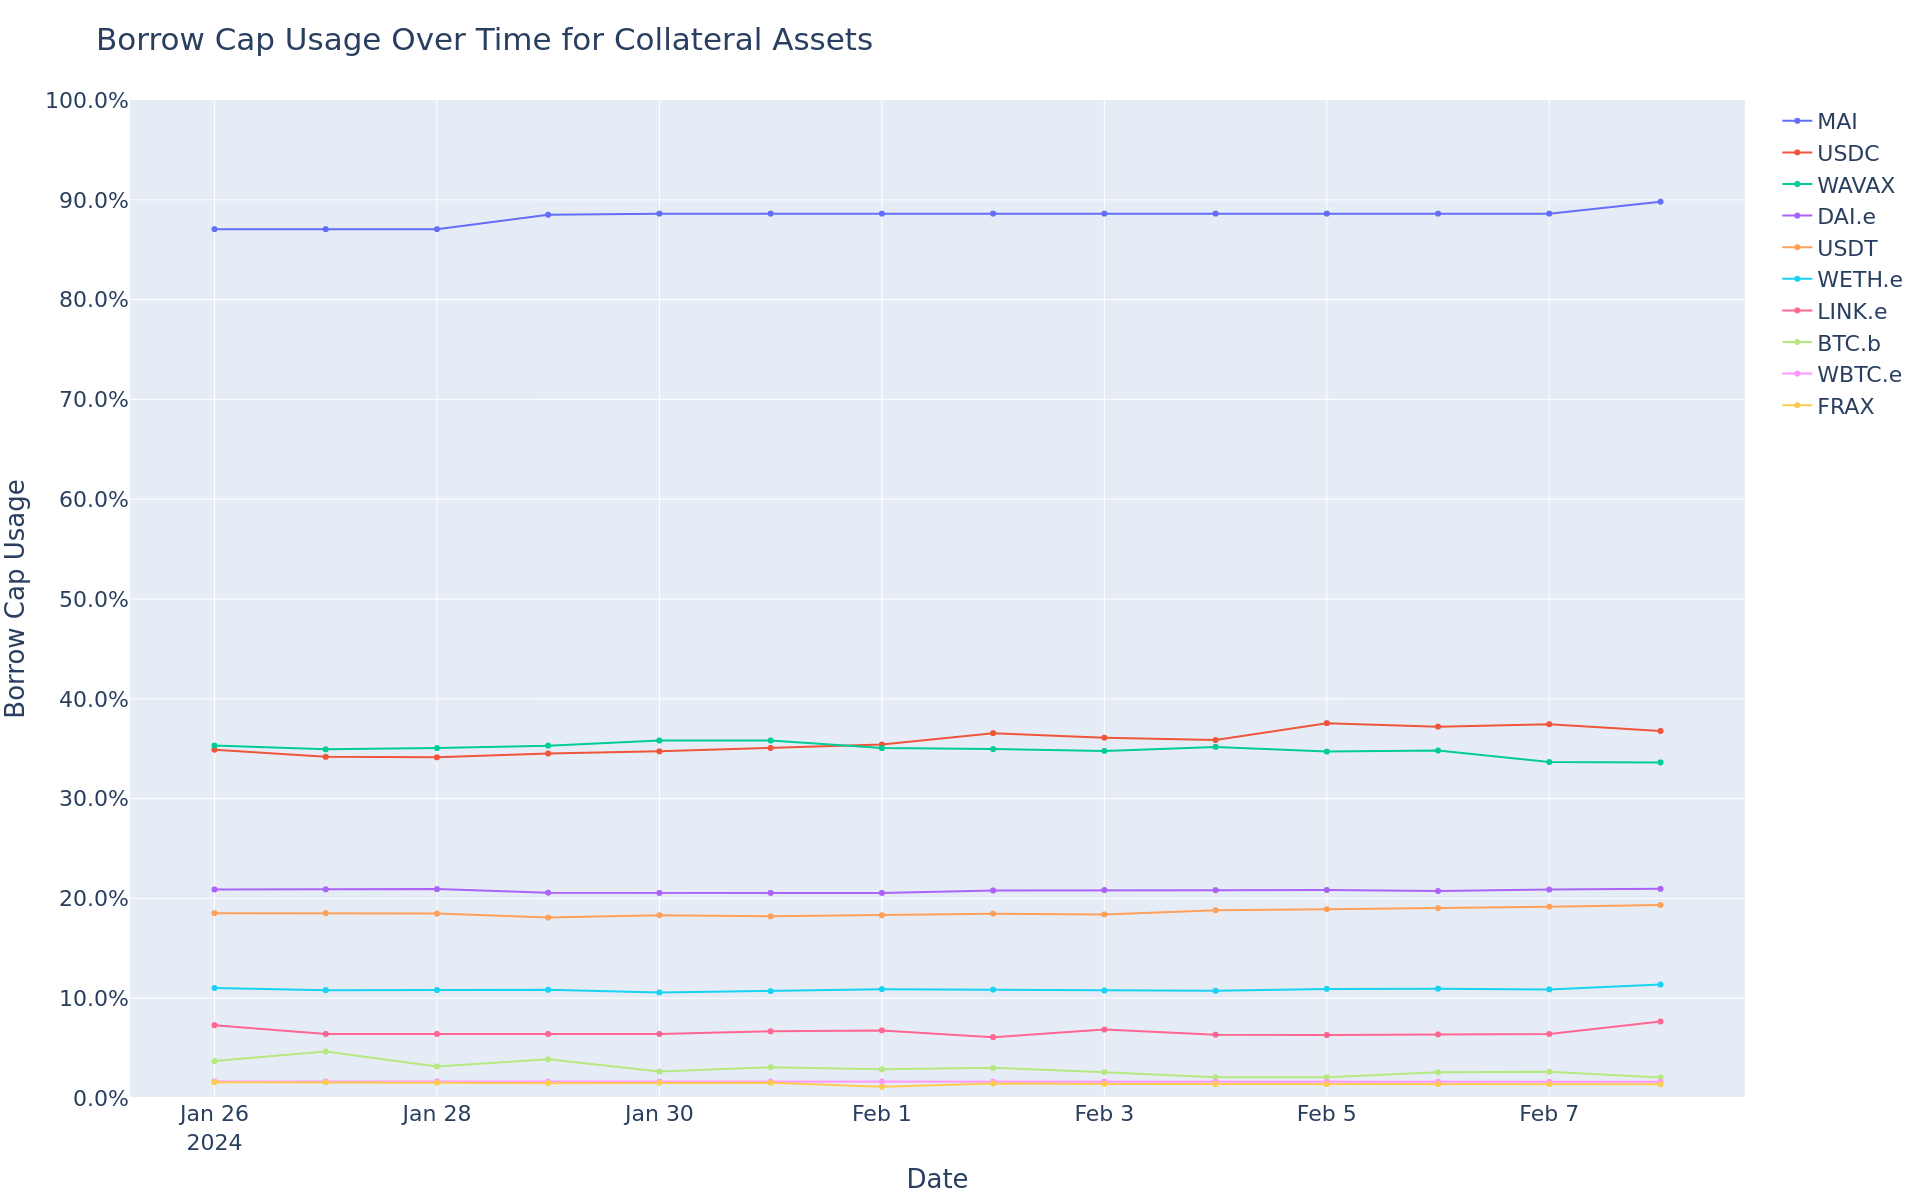
Borrow Cap Usage Trend
This graph shows the borrow cap usage (borrow / borrow cap) of all assets over the time frame in question.