[Gauntlet] V3 Polygon Market Weekly: (2024-01-26 through 2024-02-01)
Gauntlet would like to provide the community with an update on this market over the previous week. Gauntlet is continuing to monitor this market. At this time, we do not recommend any parameter updates, but will keep the community informed.
Summary
This table gives high-level statistics over the time frame in question. Bold lines correspond to weekly average supply cap usage over 75%.
LINK’s borrow balance increased WoW by 22% from $686K to $839K.
CRV’s borrow balance decreased WoW by -22% from $37K to $29K.
LINK’s supply balance increased WoW by 27% from $7M to $8M.
USDC.e’s supply balance decreased WoW by -2% from $41M to $40M.
SUSHI’s utilization increased WoW by 18% from 26% to 30%.
CRV’s utilization decreased WoW by -21% from 6% to 5%.
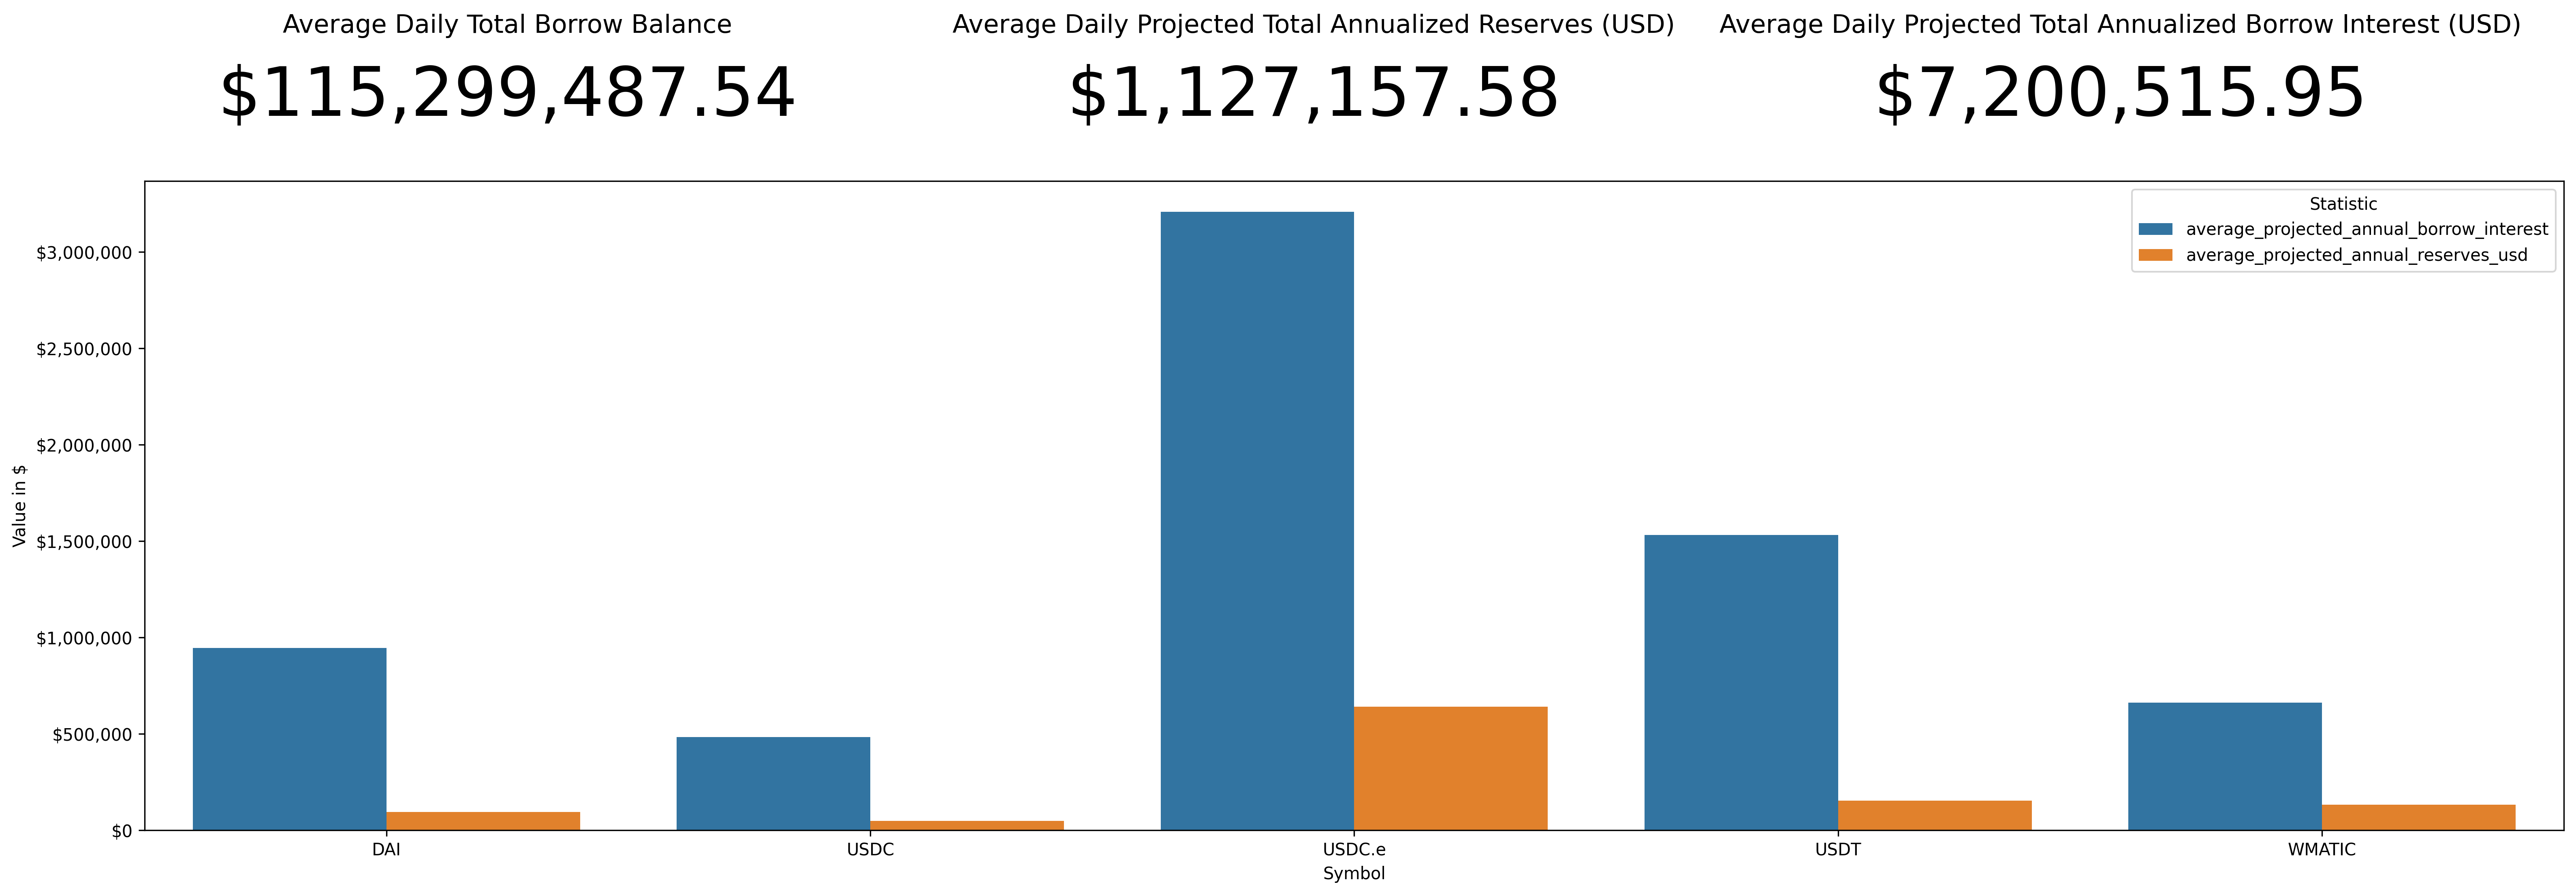
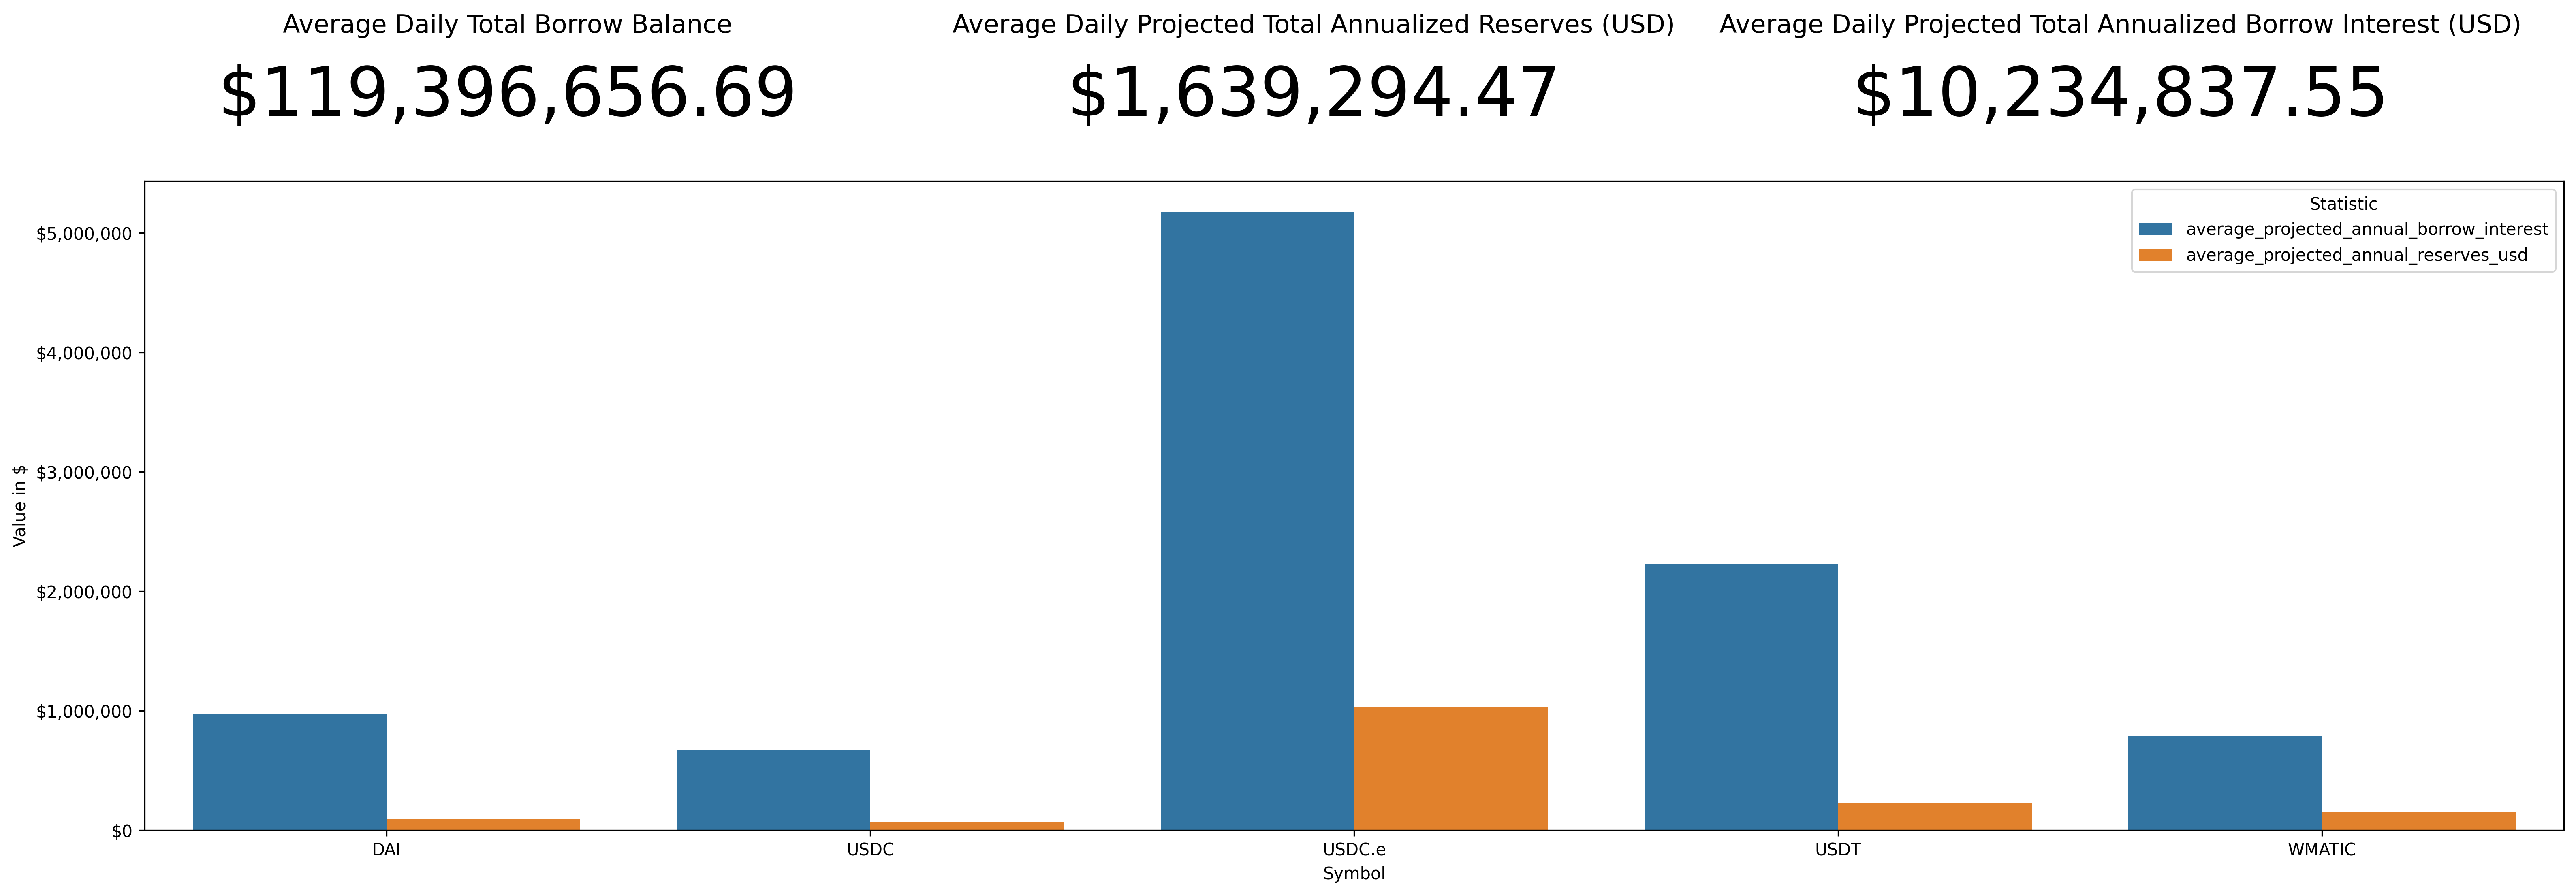
Weekly Annualized Reserve and Interest Projections
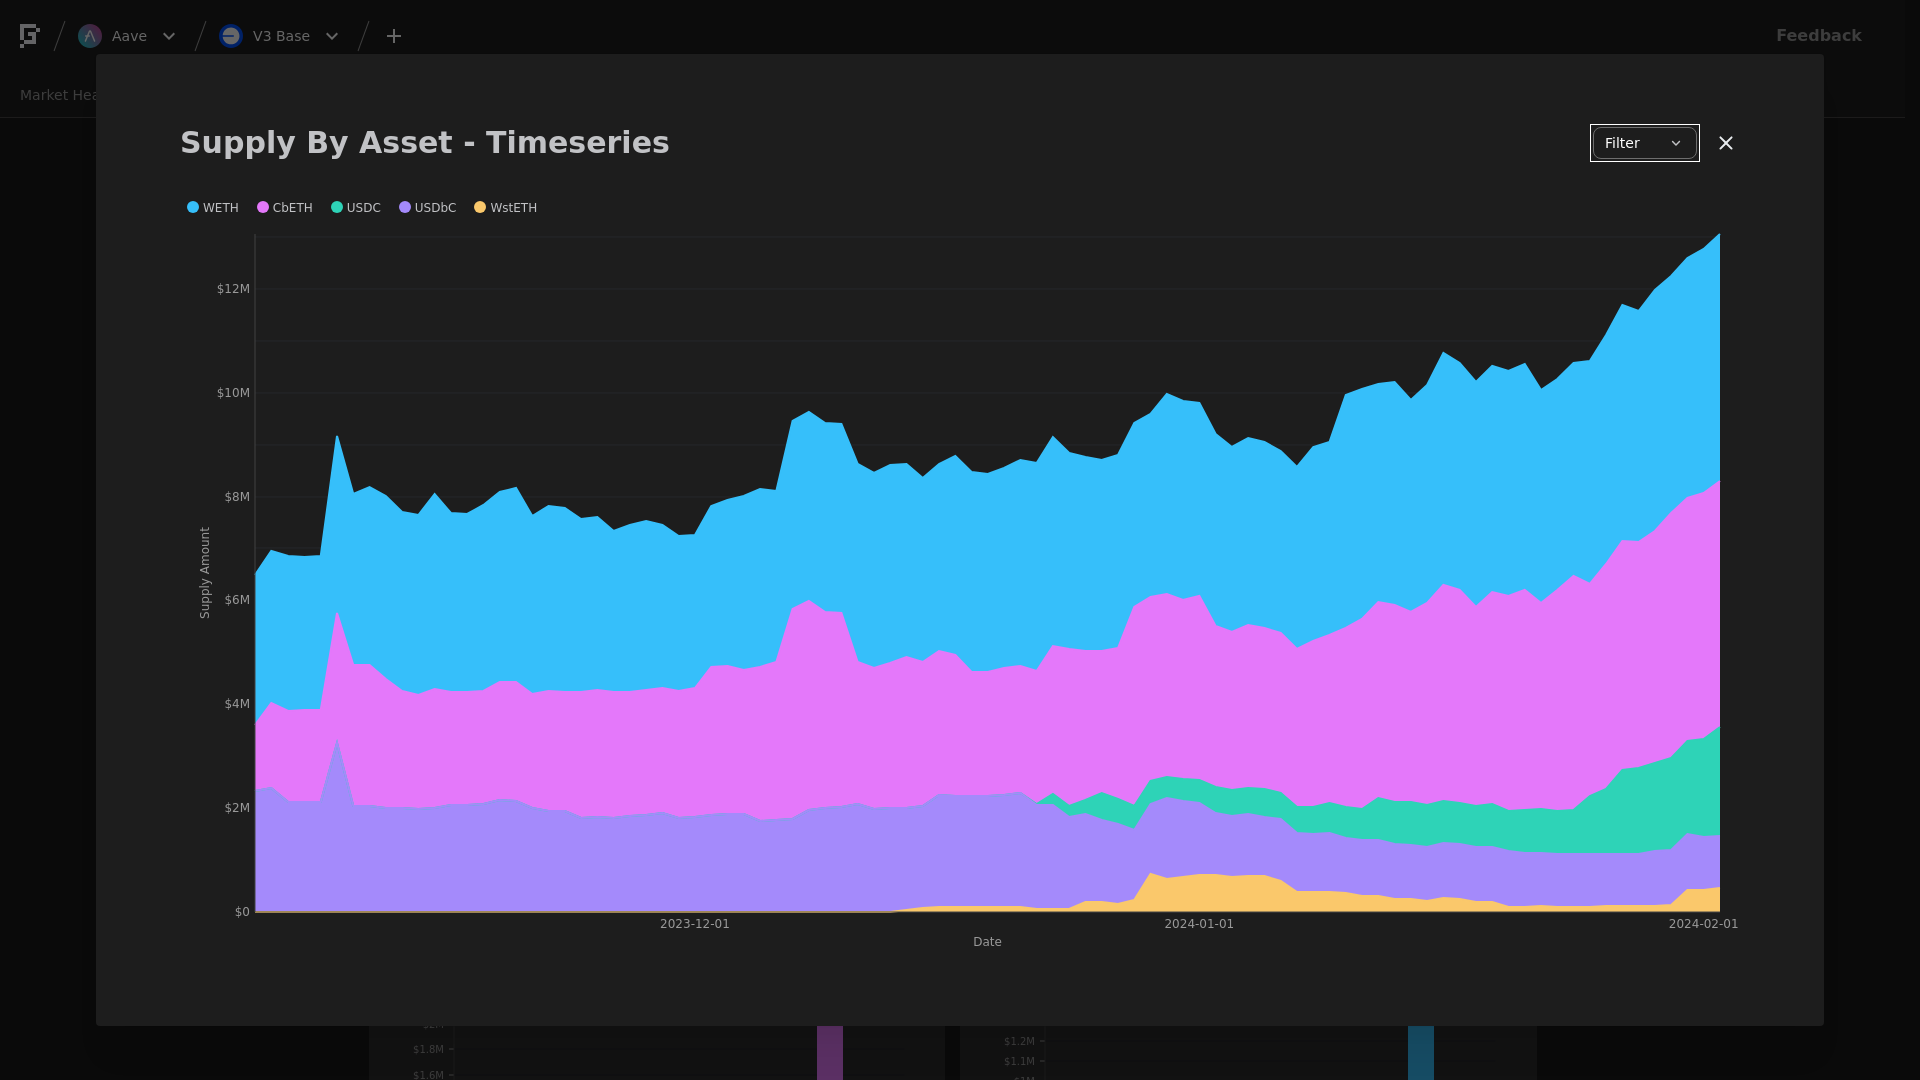
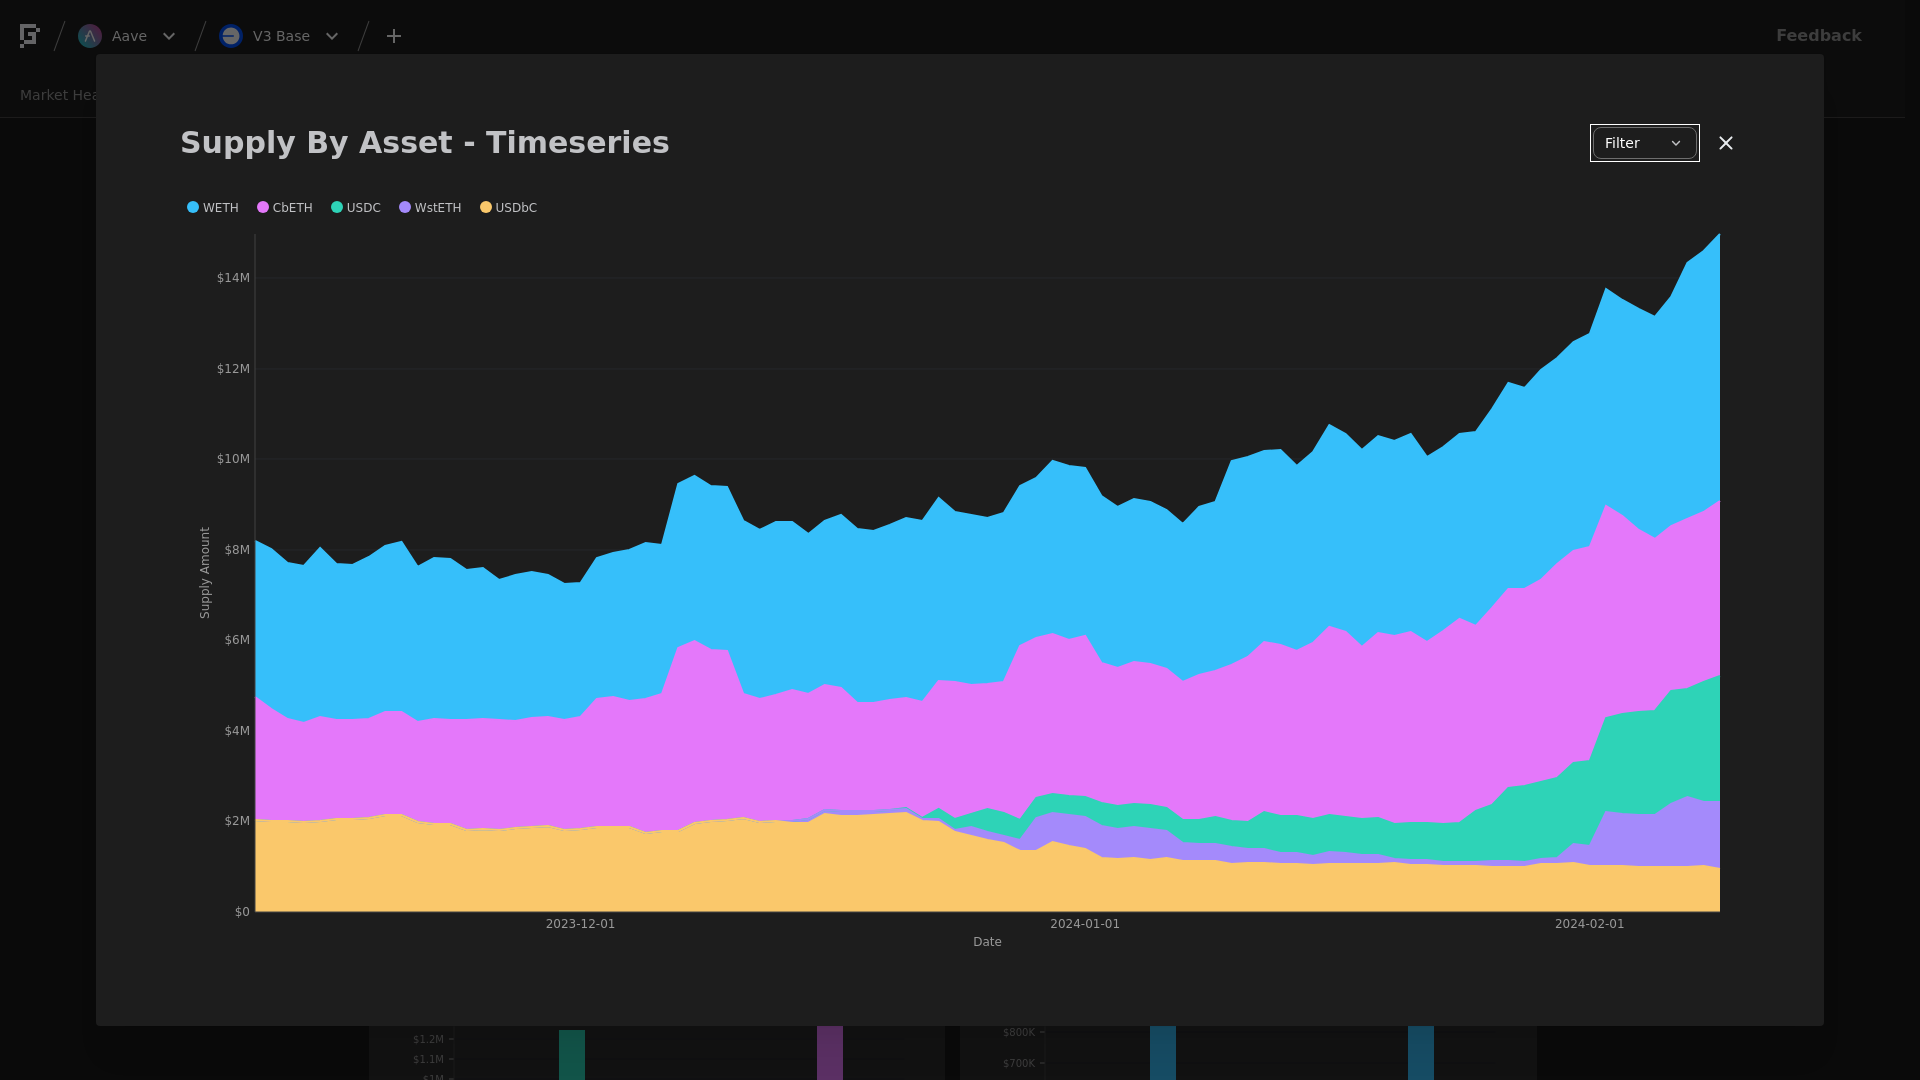
Supply Trend
This graph shows the total supply of all assets over the time frame in question. To see updated statistics, please see the live version of this graph here.
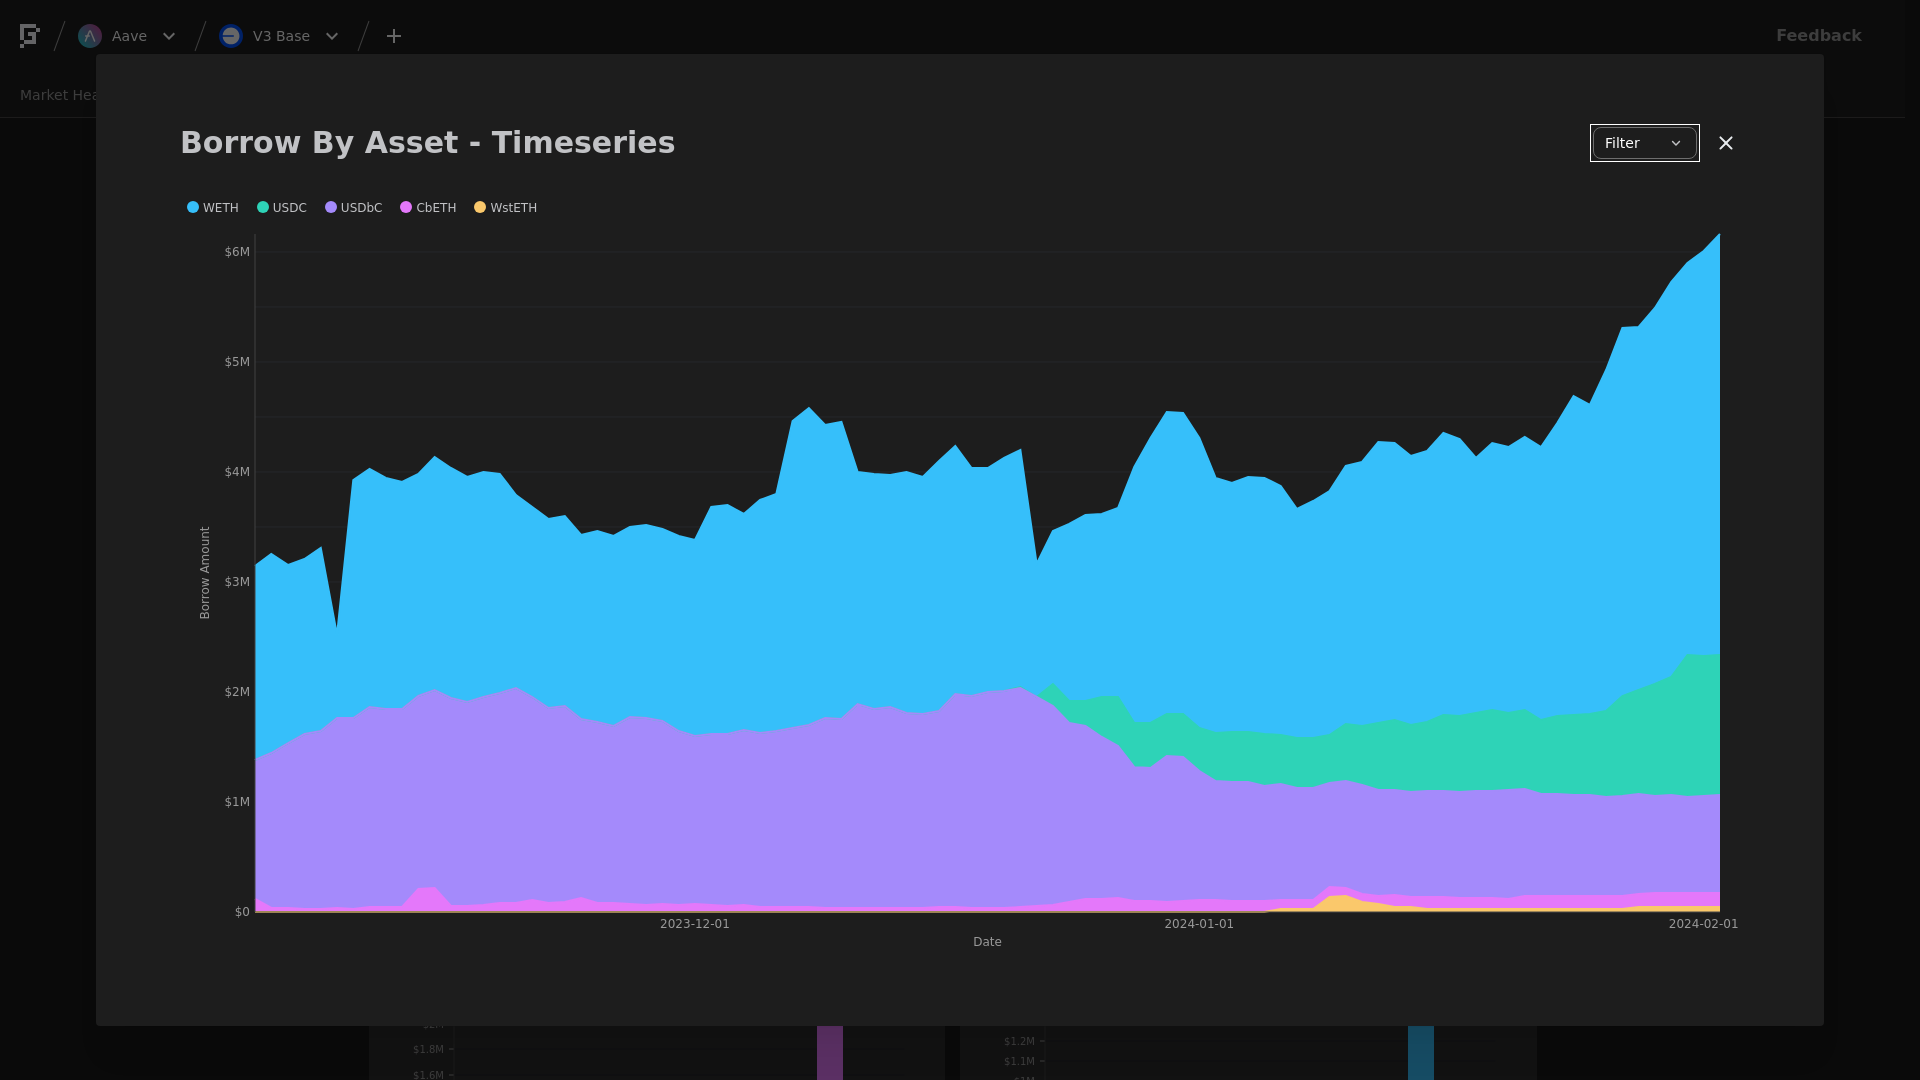
Borrows Trend
This graph shows the total borrows of all assets over the time frame in question. To see updated statistics, please see the live version of this graph here.
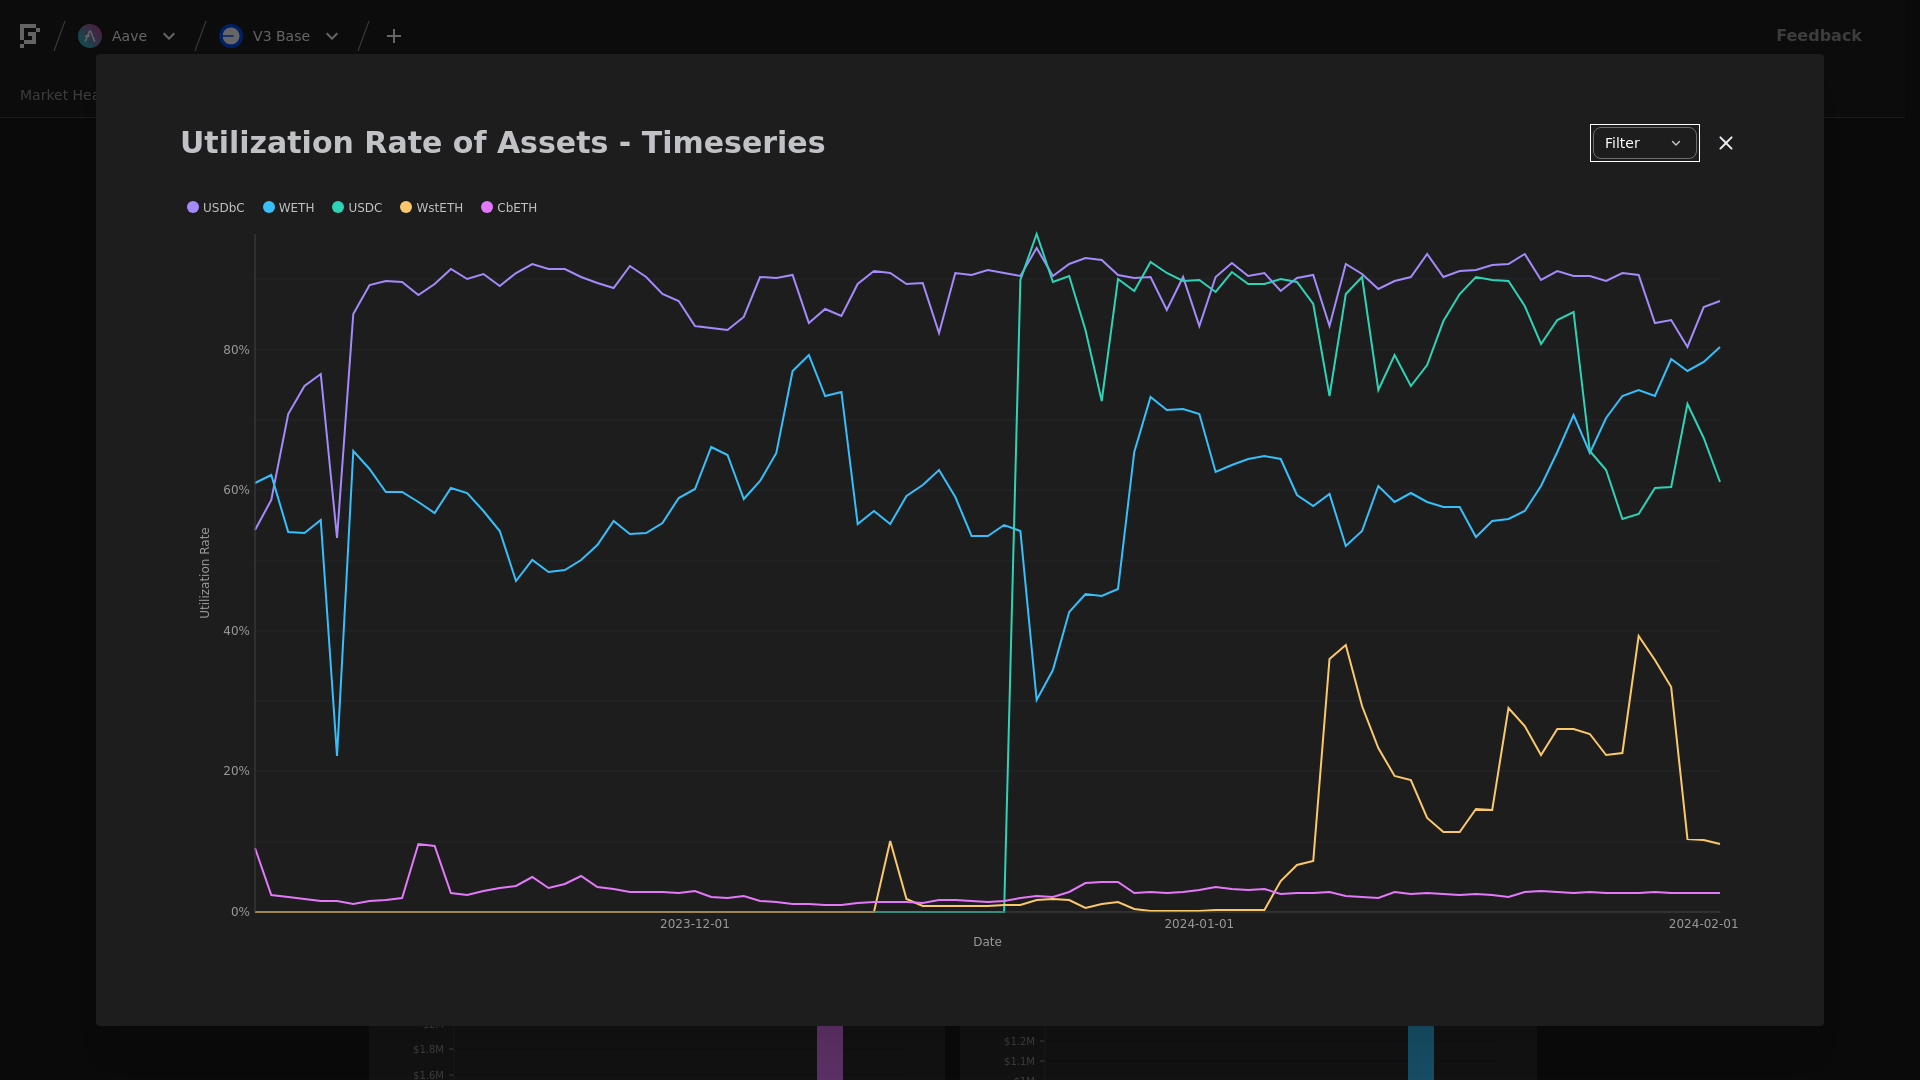
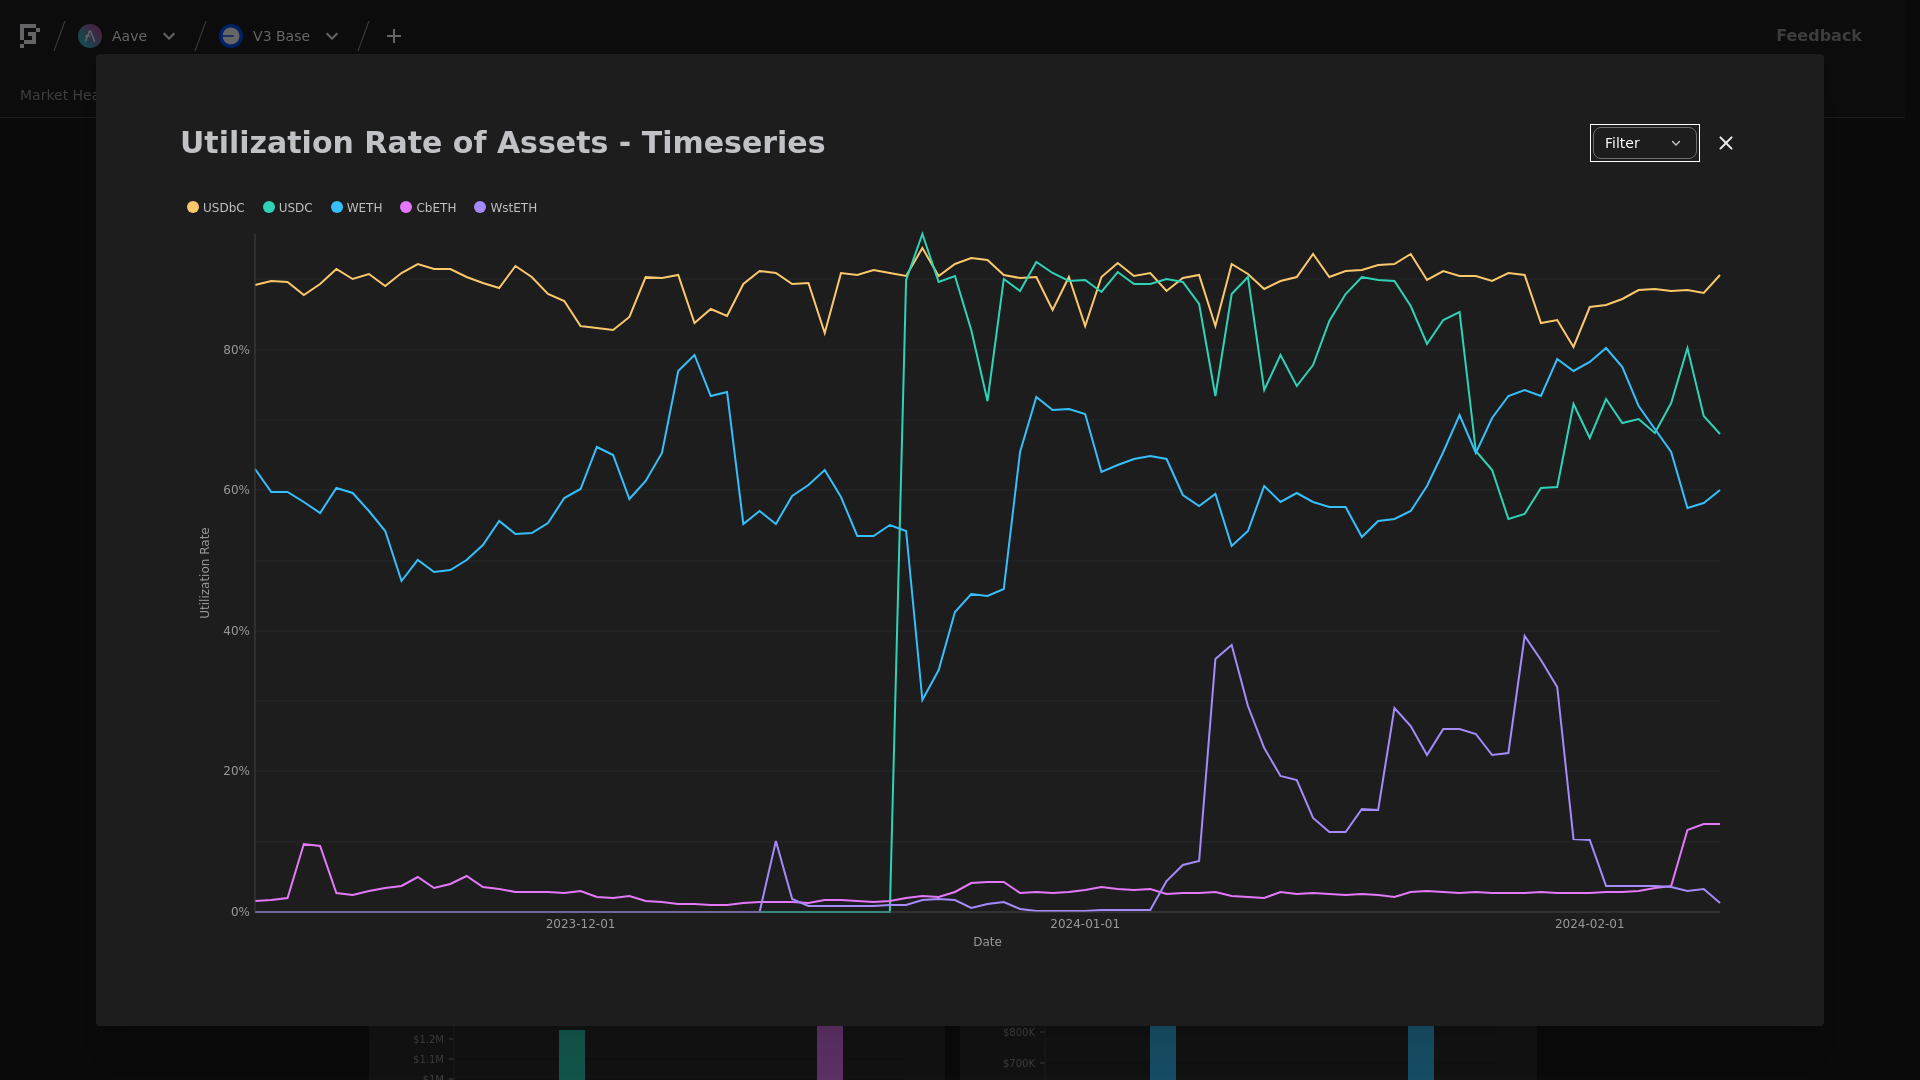
Utilization Trend
This graph shows the utilization (borrow / supply) of all assets over the time frame in question.
Supply Cap Usage Trend
This graph shows the supply cap usage (supply / supply cap) of all assets over the time frame in question.
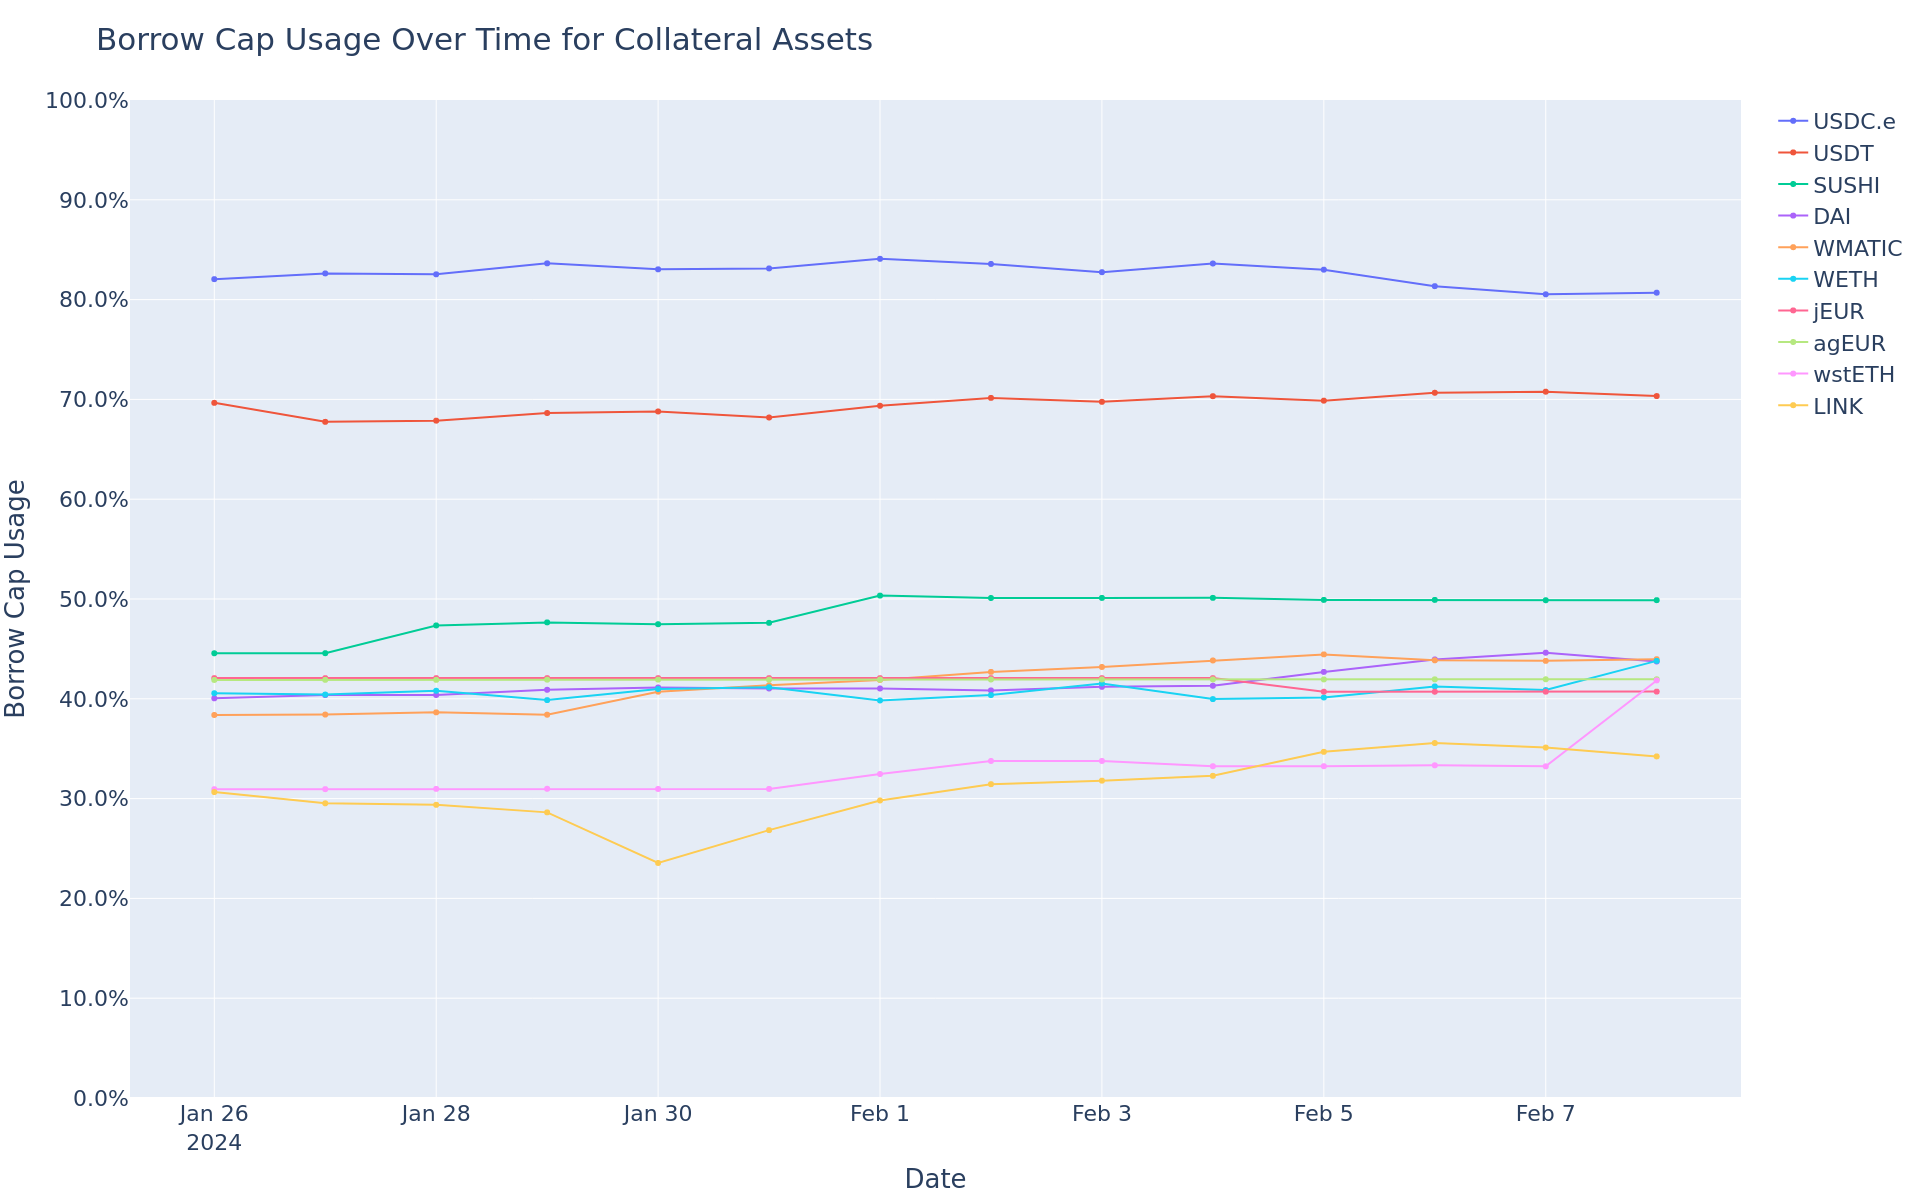
Borrow Cap Usage Trend
This graph shows the borrow cap usage (borrow / borrow cap) of all assets over the time frame in question.
[Gauntlet] Weekly Market Update - (2024-02-02 through 2024-02-08)
Gauntlet would like to provide the community with an update on this market over the previous week. Gauntlet is continuing to monitor this market. At this time, we do not recommend any parameter updates, but will keep the community informed.
Summary
This table gives high-level statistics over the time frame in question. Bold lines correspond to weekly average supply cap usage over 75%.
DPI’s borrow balance increased WoW by 56% from $15K to $23K.
BAL’s borrow balance decreased WoW by -7% from $258K to $239K.
WBTC’s supply balance increased WoW by 10% from $68M to $75M.
EURS’s supply balance decreased WoW by -6% from $700K to $660K.
DPI’s utilization increased WoW by 63% from 12% to 19%.
WBTC’s utilization decreased WoW by -11% from 4% to 4%.
Liquidations
Liquidated Asset
Liquidated Amount (Tokens)
Liquidated Amount (USD)
WBTC
0.36
$15.48K
WETH
5.48
$12.73K
USDC
12.34K
$12.34K
WMATIC
13.76K
$10.79K
DAI
403.29
$403.27
stMATIC
257.27
$219.41
AAVE
1.00
$83.66
CRV
25.28
$11.66
GHST
7.05
$6.29
Weekly Annualized Reserve and Interest Projections
Supply Trend
This graph shows the total supply of all assets over the time frame in question. To see updated statistics, please see the live version of this graph here.
Borrows Trend
This graph shows the total borrows of all assets over the time frame in question. To see updated statistics, please see the live version of this graph here.
Utilization Trend
This graph shows the utilization (borrow / supply) of all assets over the time frame in question.
Supply Cap Usage Trend
This graph shows the supply cap usage (supply / supply cap) of all assets over the time frame in question.
Borrow Cap Usage Trend
This graph shows the borrow cap usage (borrow / borrow cap) of all assets over the time frame in question.
[Gauntlet] Weekly Market Update - (2024-02-09 through 2024-02-15)
Gauntlet would like to provide the community with an update on this market over the previous week. Gauntlet is continuing to monitor this market. At this time, we do not recommend any parameter updates, but will keep the community informed.
Summary
This table gives high-level statistics over the time frame in question. Bold lines correspond to weekly average supply/borrow cap usage over 75%.
Asset
Current Borrow Cap
Current Supply Cap
Average Borrow Cap Usage (Past Week)
Average Supply Cap Usage (Past Week)
Average Utilization
Current DEX 25% Slippage (USD)
WMATIC
67.00M
105.00M
43.69%
56.26%
49.56%
$6.65M
USDC
45.00M
50.00M
18.45%
18.19%
91.28%
$4.20M
USDC.e
43.50M
48.00M
80.40%
80.35%
90.68%
$11.68M
DAI
30.00M
45.00M
44.48%
32.66%
90.79%
$2.77M
USDT
30.00M
45.00M
71.38%
52.24%
91.10%
$5.64M
MaticX
5.20M
62.00M
3.51%
99.63%
0.30%
$3.63M
EURS
1.50M
4.00M
33.33%
15.16%
82.44%
$126.15K
agEUR
250.00K
300.00K
41.97%
45.23%
77.34%
$76.71K
GHST
220.00K
4.65M
11.47%
46.02%
1.18%
$1.01M
LINK
163.70K
668.00K
27.28%
74.21%
9.01%
$4.50M
WETH
14.79K
50.00K
42.57%
52.53%
23.98%
$68.76M
WBTC
851.00
3.10K
7.38%
53.57%
3.78%
$1.10B
wstETH
570.00
4.37K
43.77%
100.00%
5.71%
$382.50K
Top Movers
WBTC’s borrow balance increased WoW by 57% from $3M to $4M.
LINK’s borrow balance decreased WoW by -63% from $1M to $377K.
USDC’s supply balance increased WoW by 28% from $8M to $10M.
miMATIC’s supply balance decreased WoW by -5% from $147K to $139K.
WBTC’s utilization increased WoW by 36% from 4% to 5%.
LINK’s utilization decreased WoW by -67% from 11% to 4%.
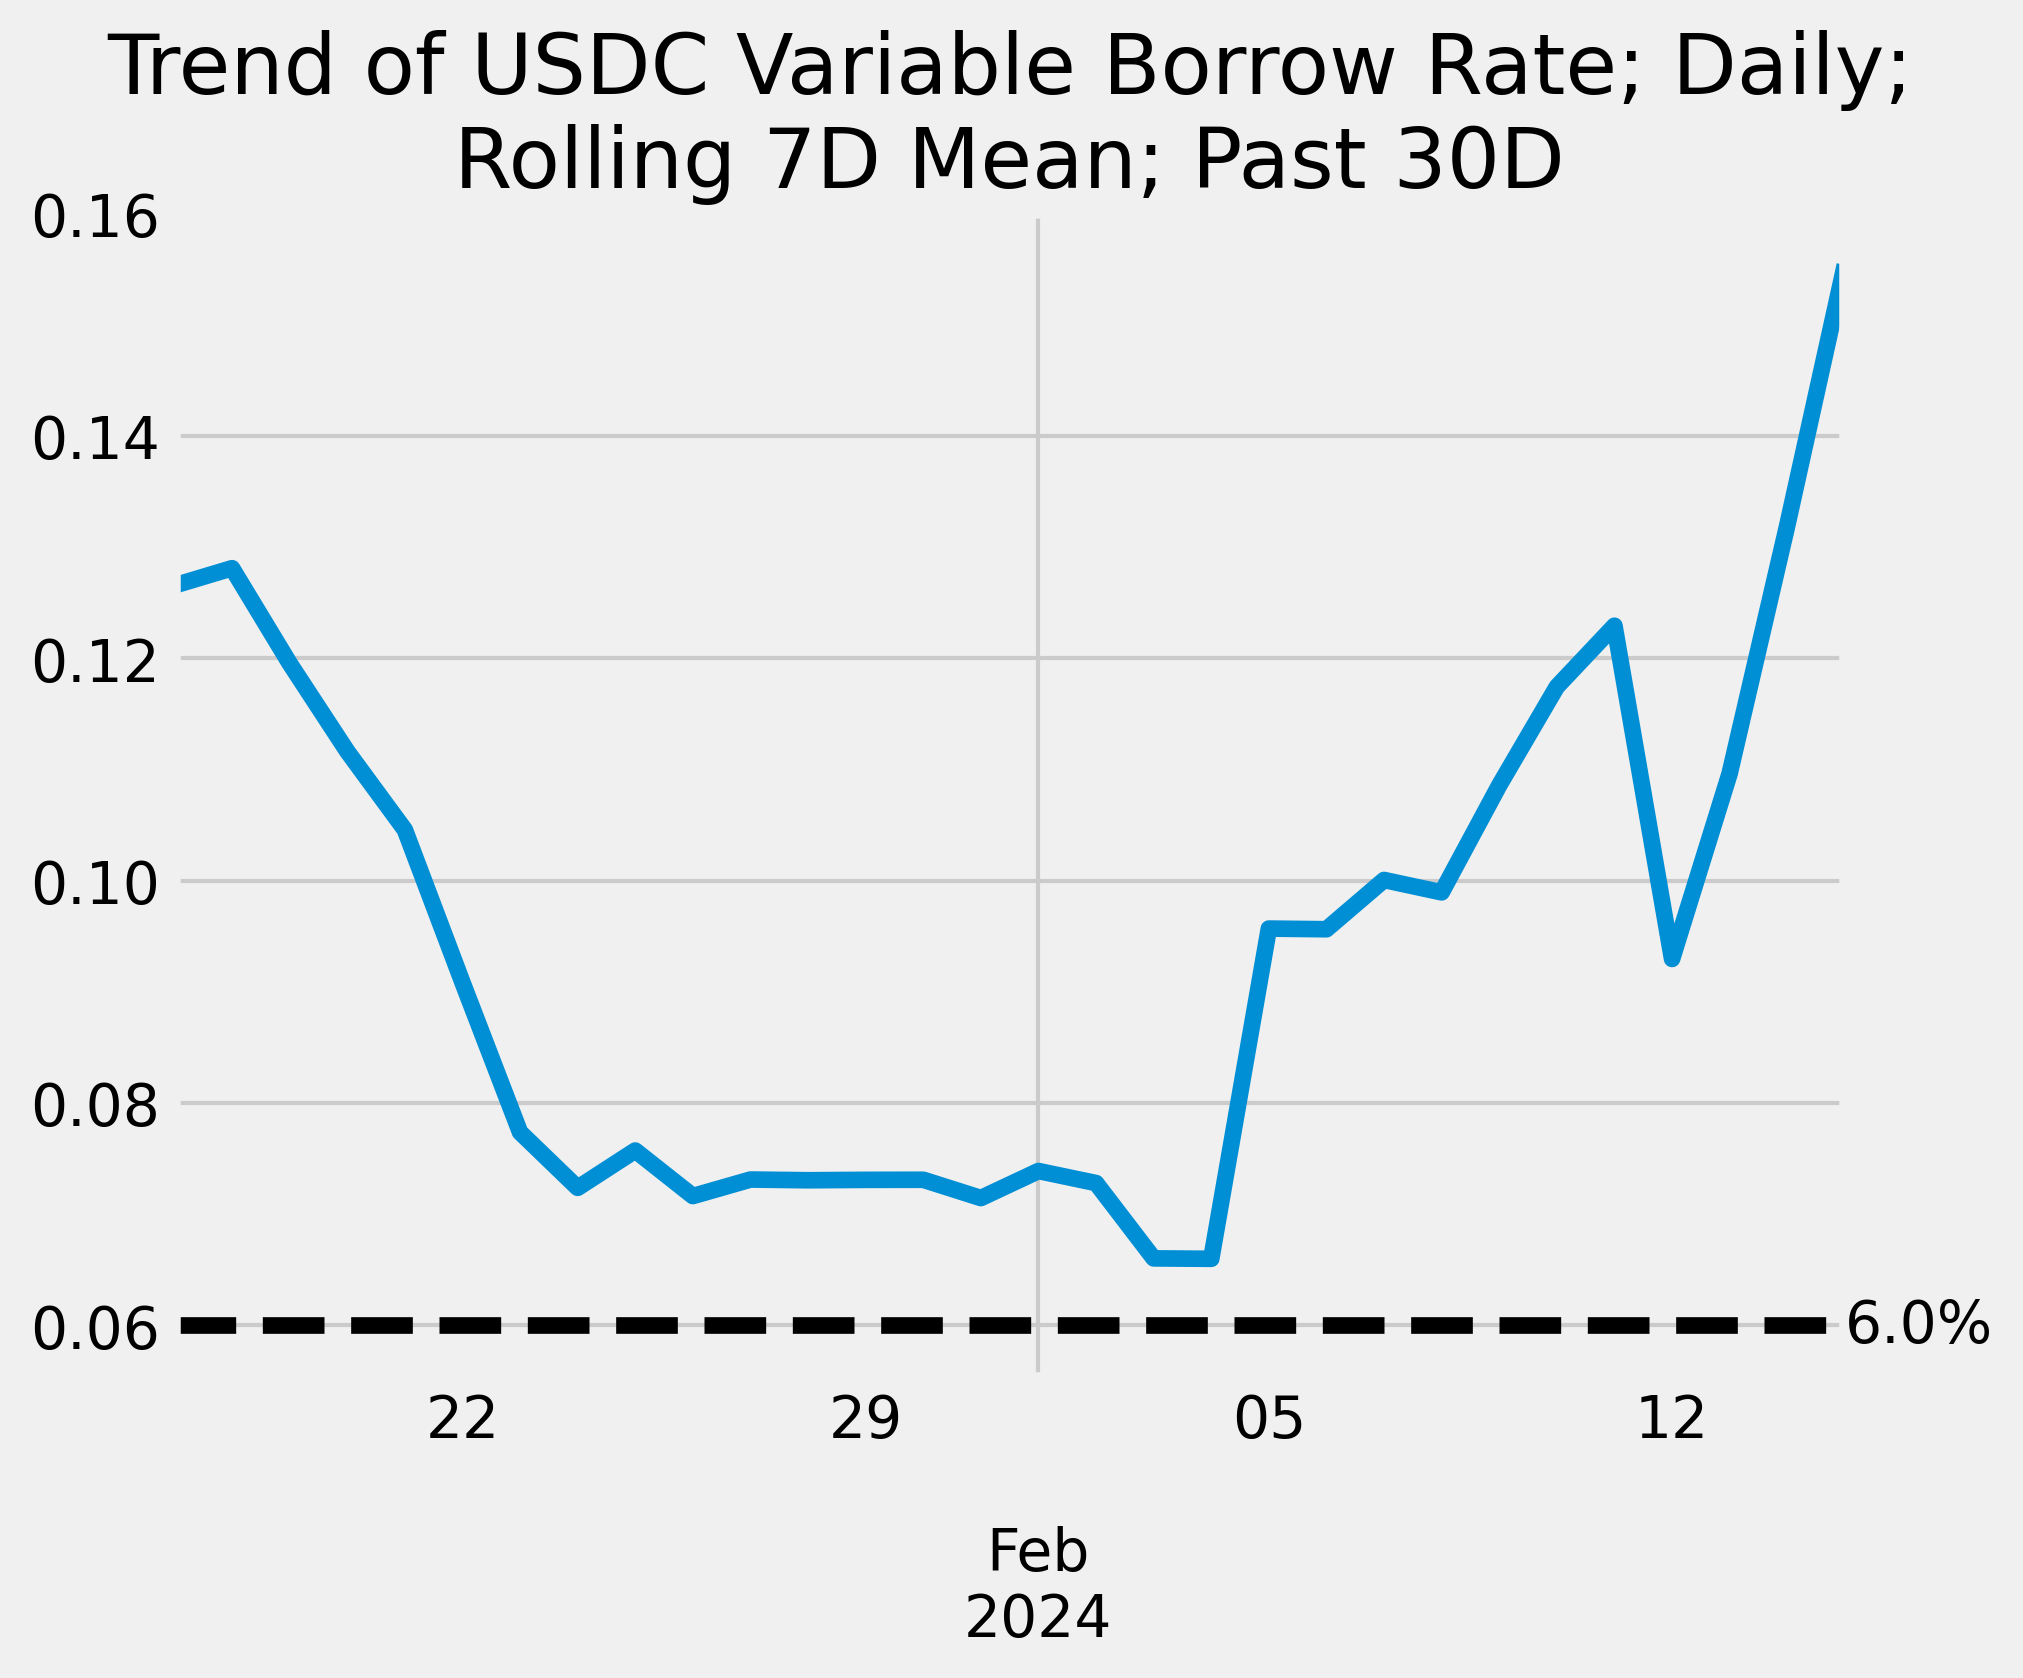
Key Interest Rates
Liquidations
Liquidated Asset
Liquidated Amount (Tokens)
Liquidated Amount (USD)
USDC
20.50K
$20.50K
WETH
4.25
$10.57K
WBTC
0.12
$5.60K
WMATIC
1.77K
$1.49K
DAI
213.26
$213.26
AAVE
0.16
$14.33
CRV
2.12
$1.07
Weekly Annualized Reserve and Interest Projections
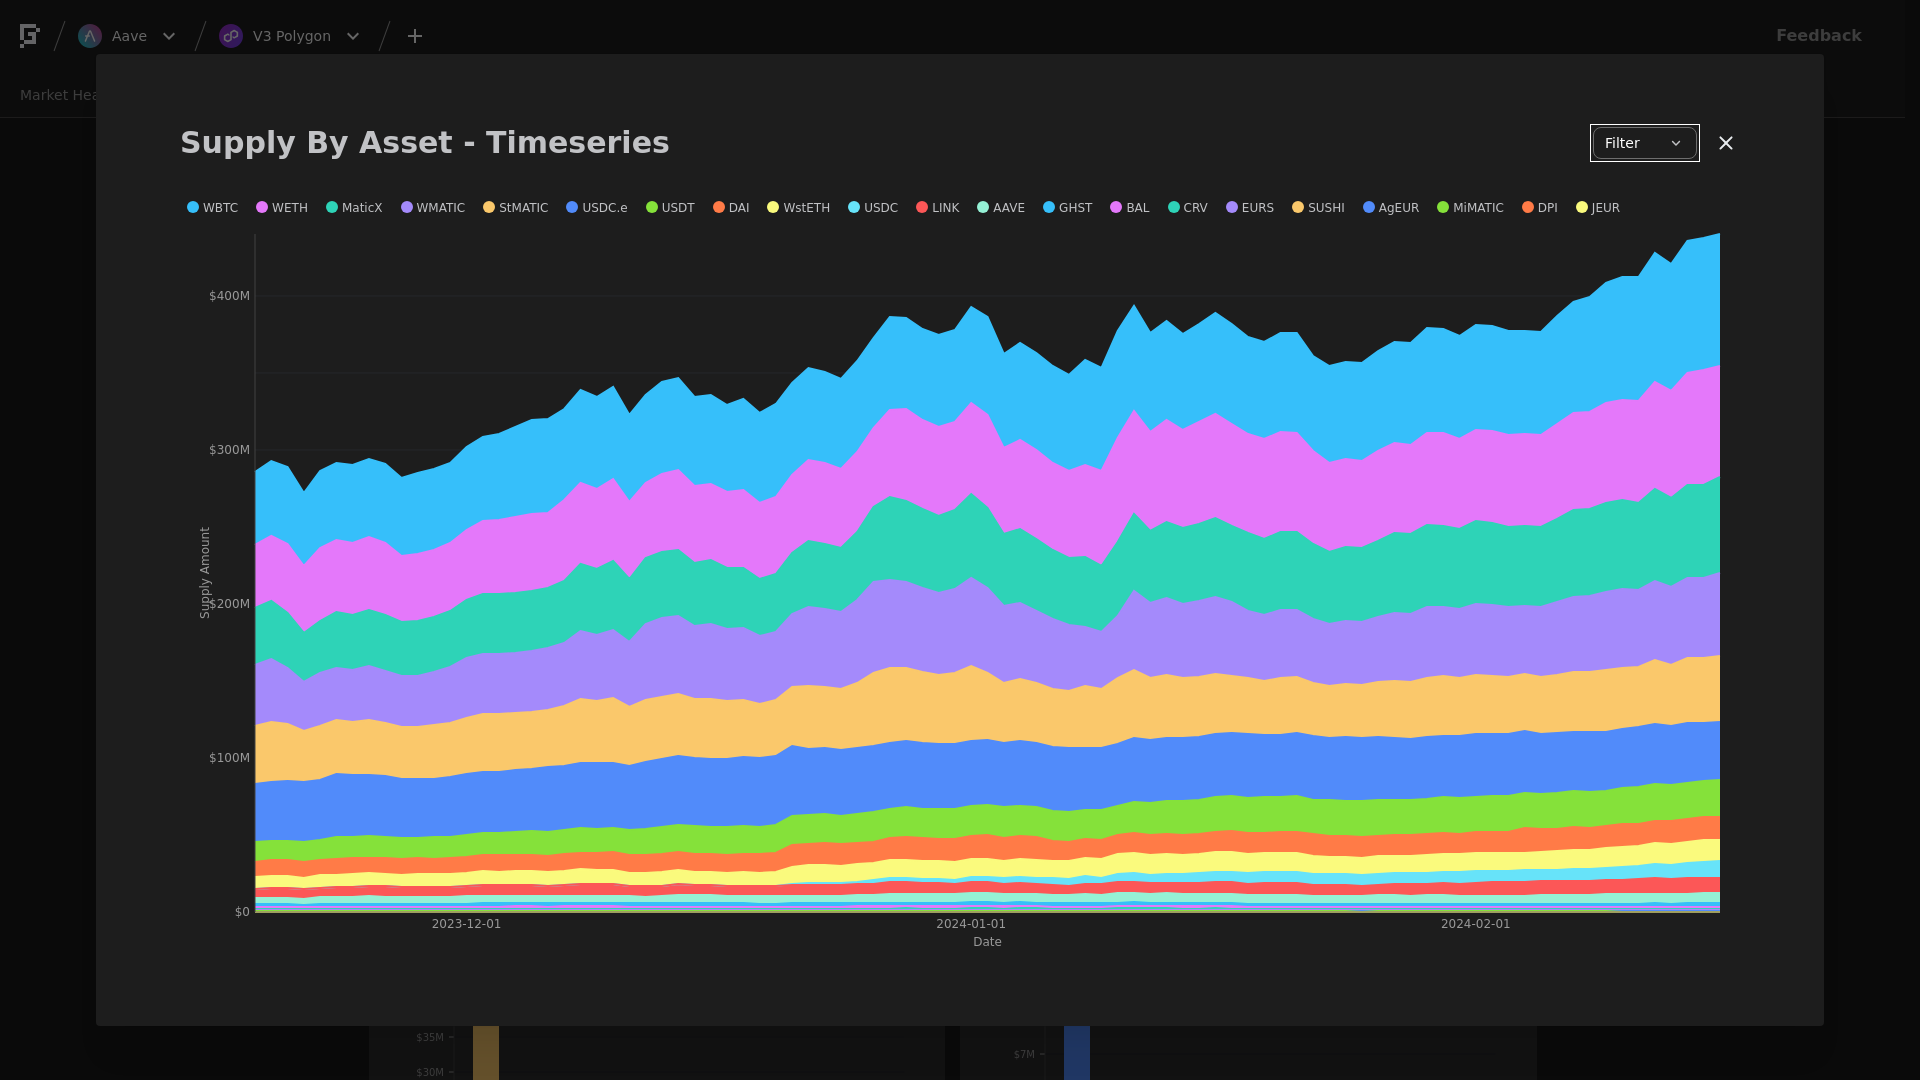
Supply Trend
This graph shows the total supply of all assets over the time frame in question. To see updated statistics, please see the live version of this graph here.
Borrows Trend
This graph shows the total borrows of all assets over the time frame in question. To see updated statistics, please see the live version of this graph here.
Utilization Trend
This graph shows the utilization (borrow / supply) of all assets over the time frame in question.
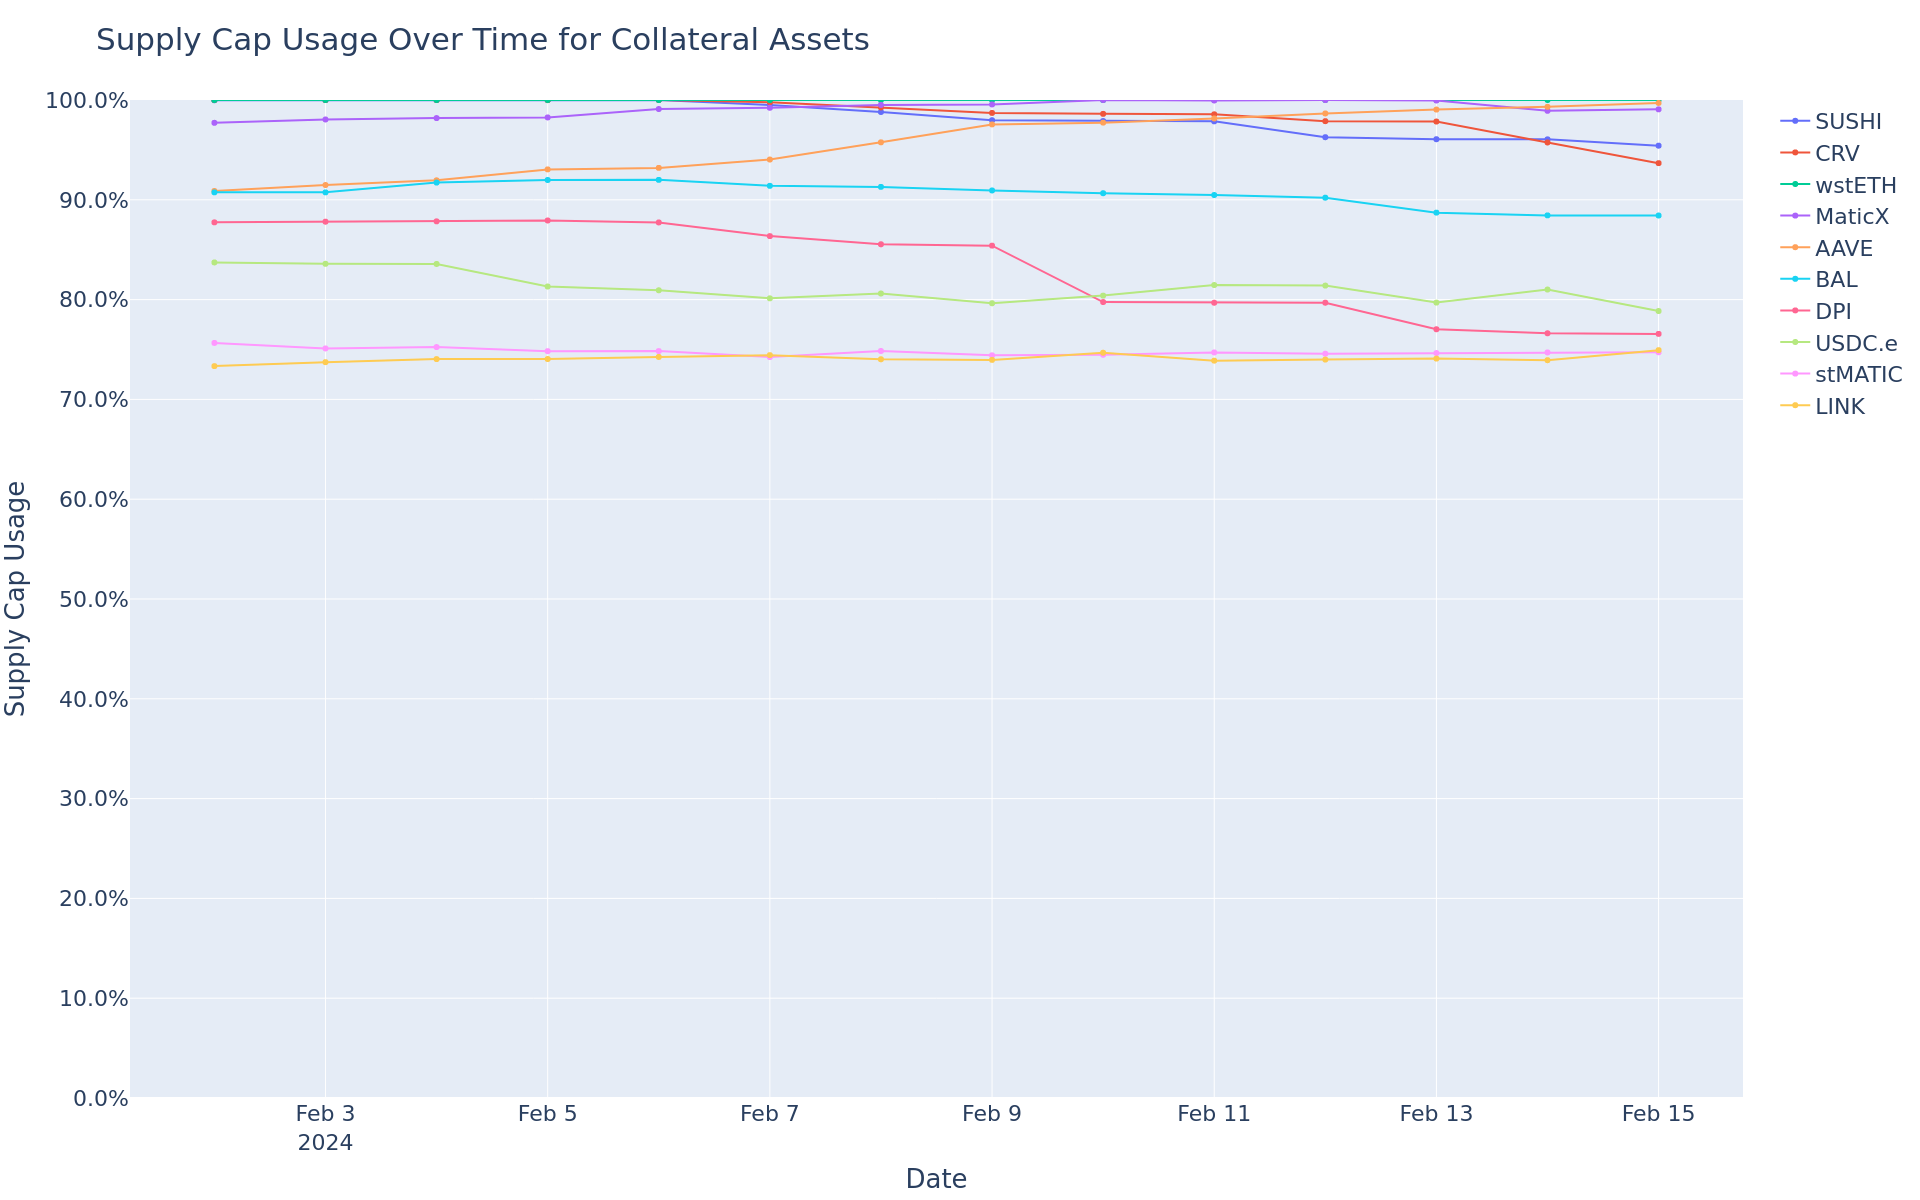
Supply Cap Usage Trend
This graph shows the supply cap usage (supply / supply cap) of all assets over the time frame in question.
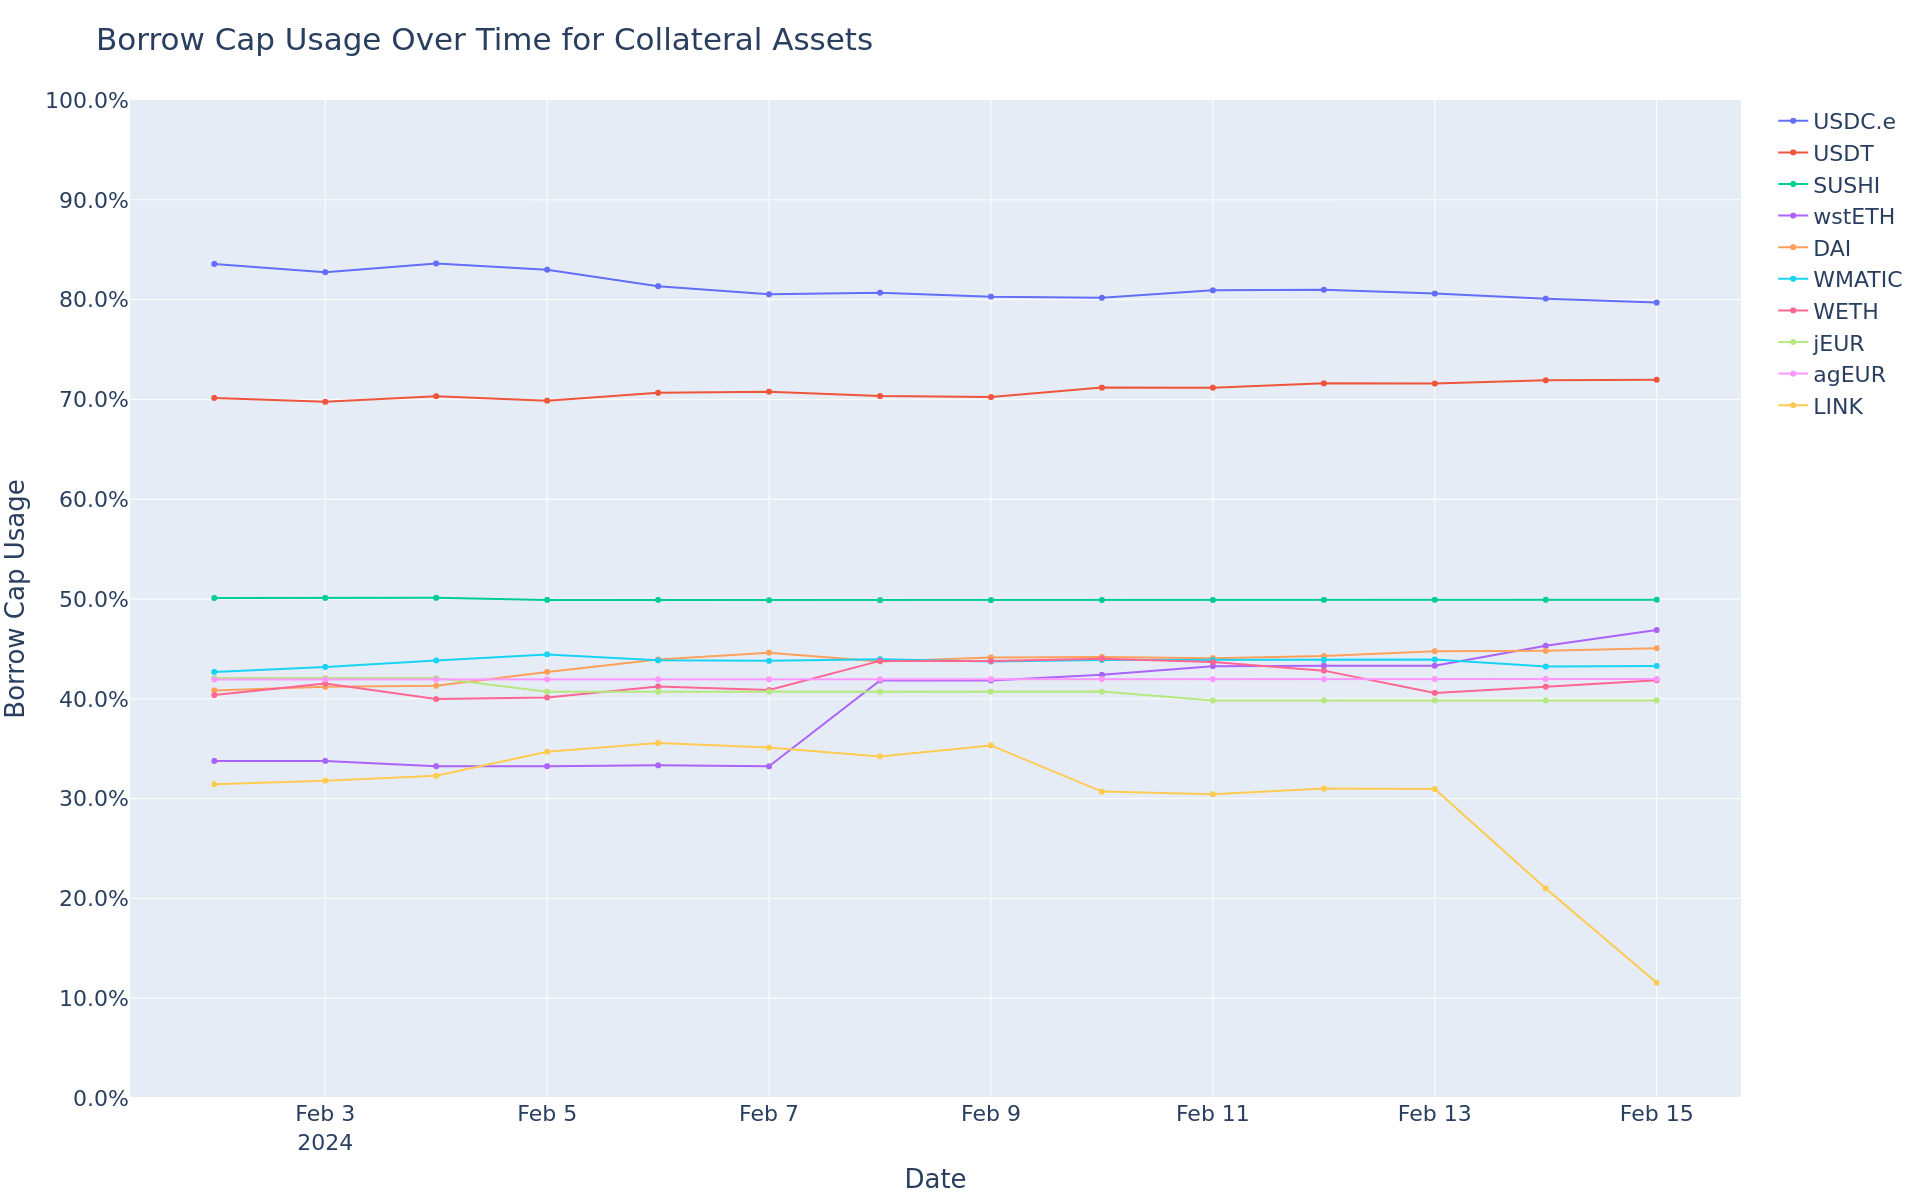
Borrow Cap Usage Trend
This graph shows the borrow cap usage (borrow / borrow cap) of all assets over the time frame in question.