[Gauntlet] Weekly Market Update - (2024-01-19 through 2024-01-25)
Gauntlet would like to provide the community with an update on this market over the previous week. Gauntlet is continuing to monitor this market. At this time, we do not recommend any parameter updates, but will keep the community informed.
Summary
This table gives high-level statistics over the time frame in question.
note:
Gauntlet has decided to withhold its recommendation to increase the supply cap for wstETH, noting that its current utilization stands at only 77%. A significant factor in this decision is the availability of approximately $600 million in liquidity from the largest wstETH supplier, which is four times greater than that of the second largest supplier of wstETH.
CRV supply cap usage has fallen under 50% over the week.
Asset
Current Borrow Cap
Current Supply Cap
Average Borrow Cap Usage (Past Week)
Average Supply Cap Usage (Past Week)
Current DEX 25% Slippage (Tokens)
Current DEX 25% Slippage (USD)
USDC
1,580,000K
1,760,000K
34%
34%
417,758K
417,862K
USDT
930,000K
1,000,000K
56%
59%
210,835K
210,748K
DAI
271,000K
338,000K
38%
34%
None
None
CRVUSD
50,000K
60,000K
0%
1%
52,128K
52,092K
LINK
13,000K
15,000K
0%
52%
1,642K
22,632K
FRAX
12,000K
15,000K
6%
6%
62,593K
62,468K
LUSD
8,000K
18,000K
50%
29%
18,210K
18,251K
STG
5,500K
10,000K
0%
18%
11,509K
5,737K
CRV
5,000K
10,000K
15%
77%
6,459K
2,927K
LDO
3,000K
6,000K
0%
22%
2,351K
6,958K
WETH
1,400K
1,800K
30%
34%
130K
288,173K
SNX
1,100K
4,500K
3%
57%
522K
1,633K
1INCH
720K
30,000K
12%
59%
3,570K
1,341K
KNC
650K
1,200K
3%
14%
784K
457K
FXS
500K
1,200K
1%
56%
1,052K
10,379K
UNI
500K
4,000K
8%
51%
1,384K
7,964K
RPL
480K
840K
33%
58%
55K
1,549K
BAL
370K
1,400K
31%
54%
3,789K
13,326K
ENS
40K
1,500K
12%
54%
77K
1,399K
WBTC
28K
43K
6%
44%
4K
165,144K
wstETH
24K
1,100K
16%
77%
60K
154,756K
rETH
19K
90K
3%
51%
43K
104,455K
MKR
3K
22K
16%
60%
17K
36,570K
cbETH
2K
60K
20%
22%
2K
4,778K
Top Movers
STG’s borrow balance increased WoW by 246.35% from $1.96K to $6.79K.
ENS’s borrow balance decreased WoW by -75.64% from $316.35K to $77.07K.
MKR’s supply balance increased WoW by 20.04% from $25,905.74K to $31,096.78K.
STG’s utilization increased WoW by 448.37% from 0.16% to 0.90%.
ENS’s utilization decreased WoW by -71.57% from 1.85% to 0.53%.
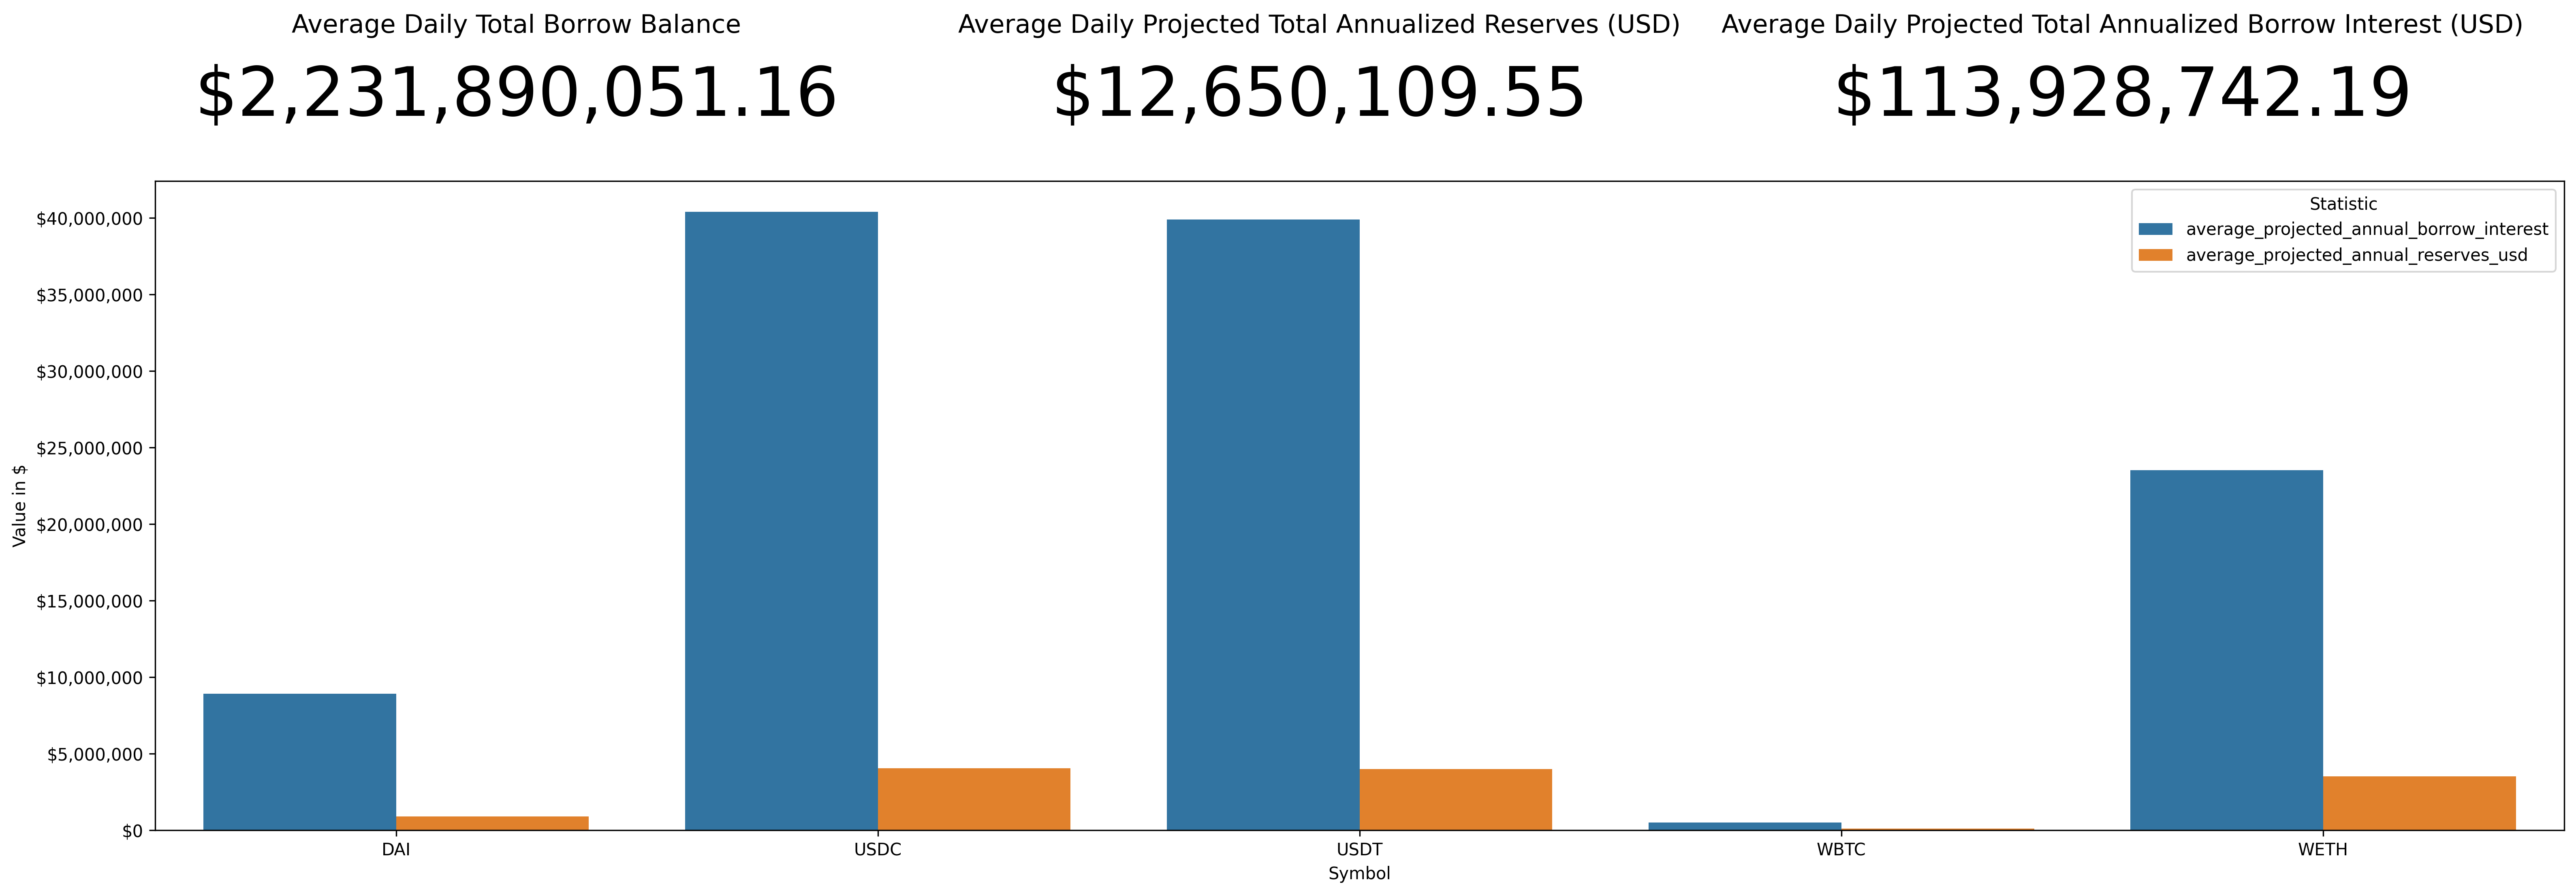
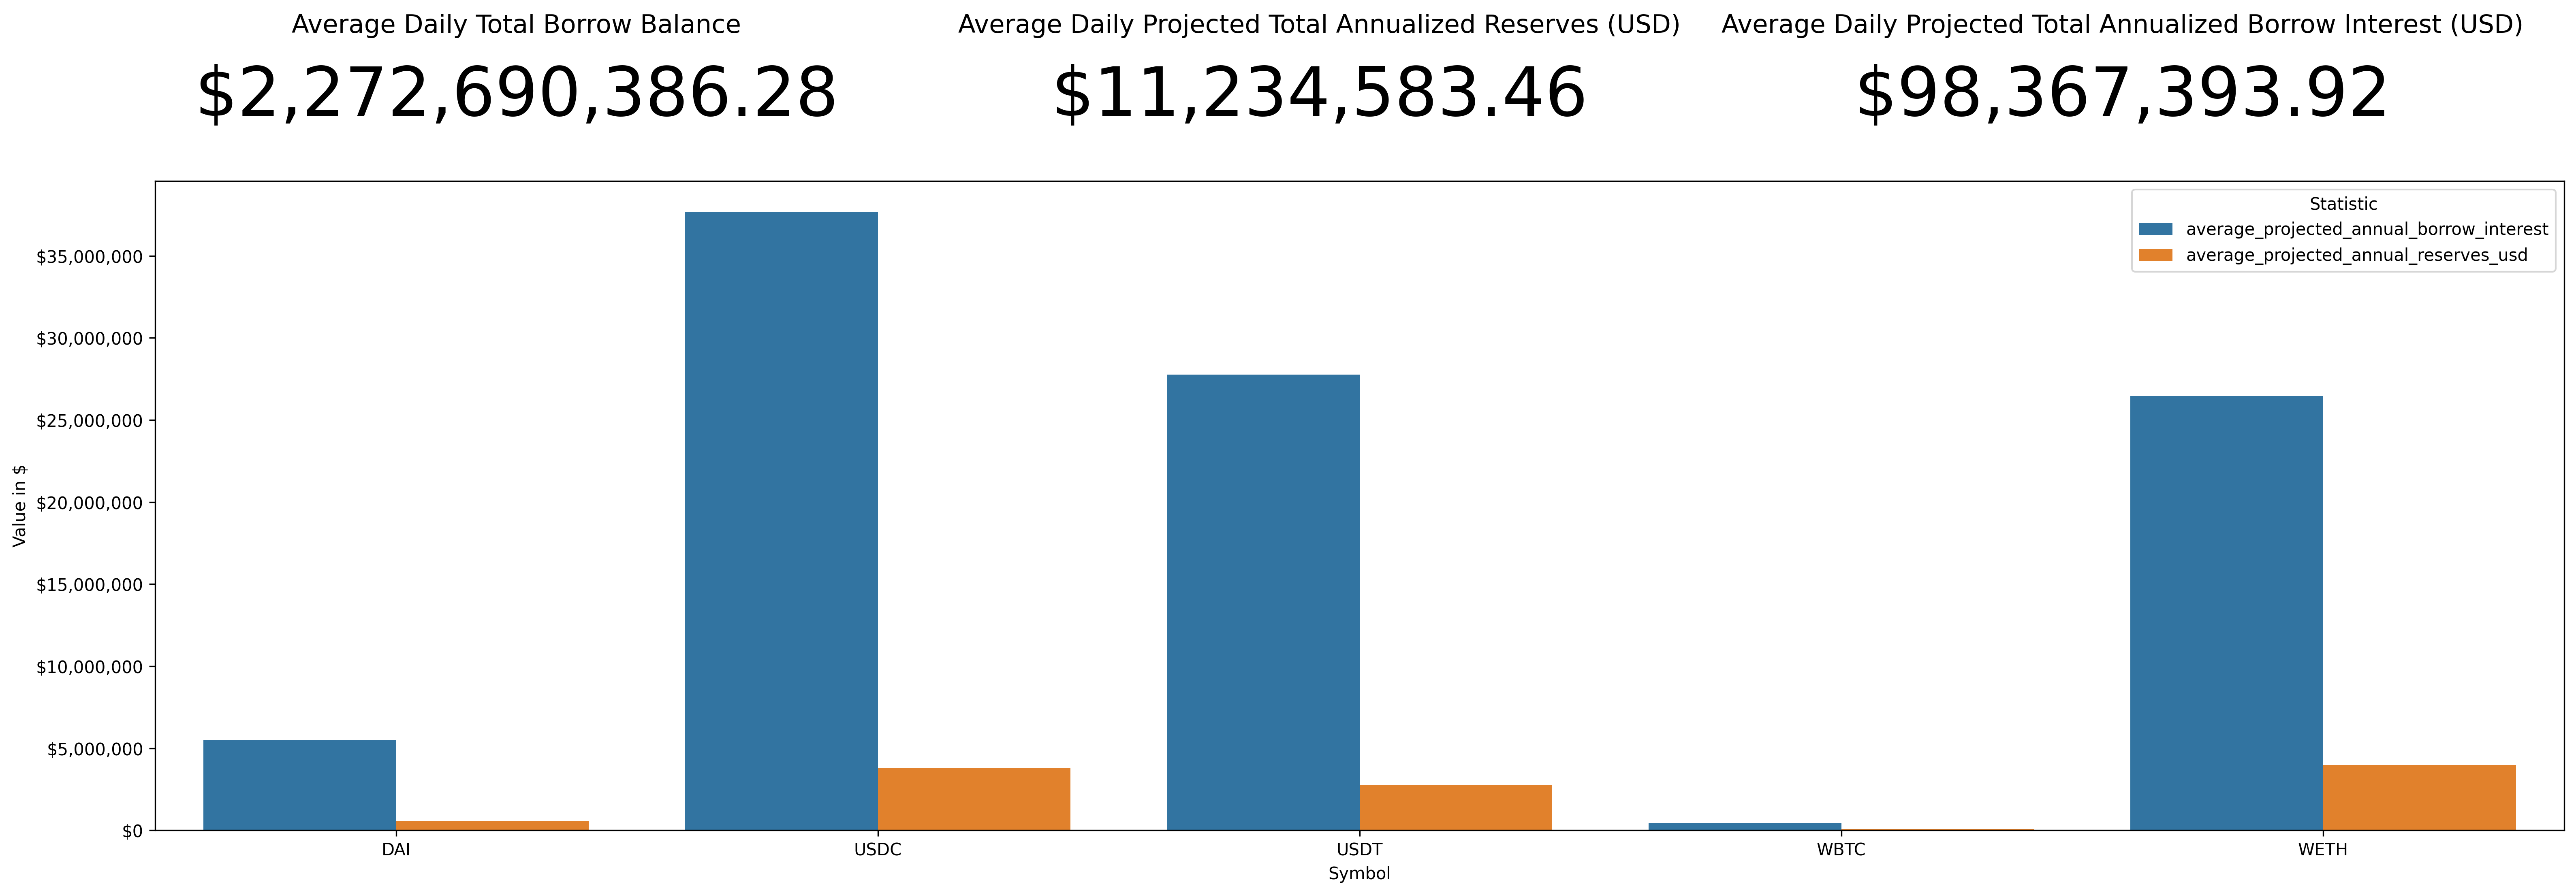
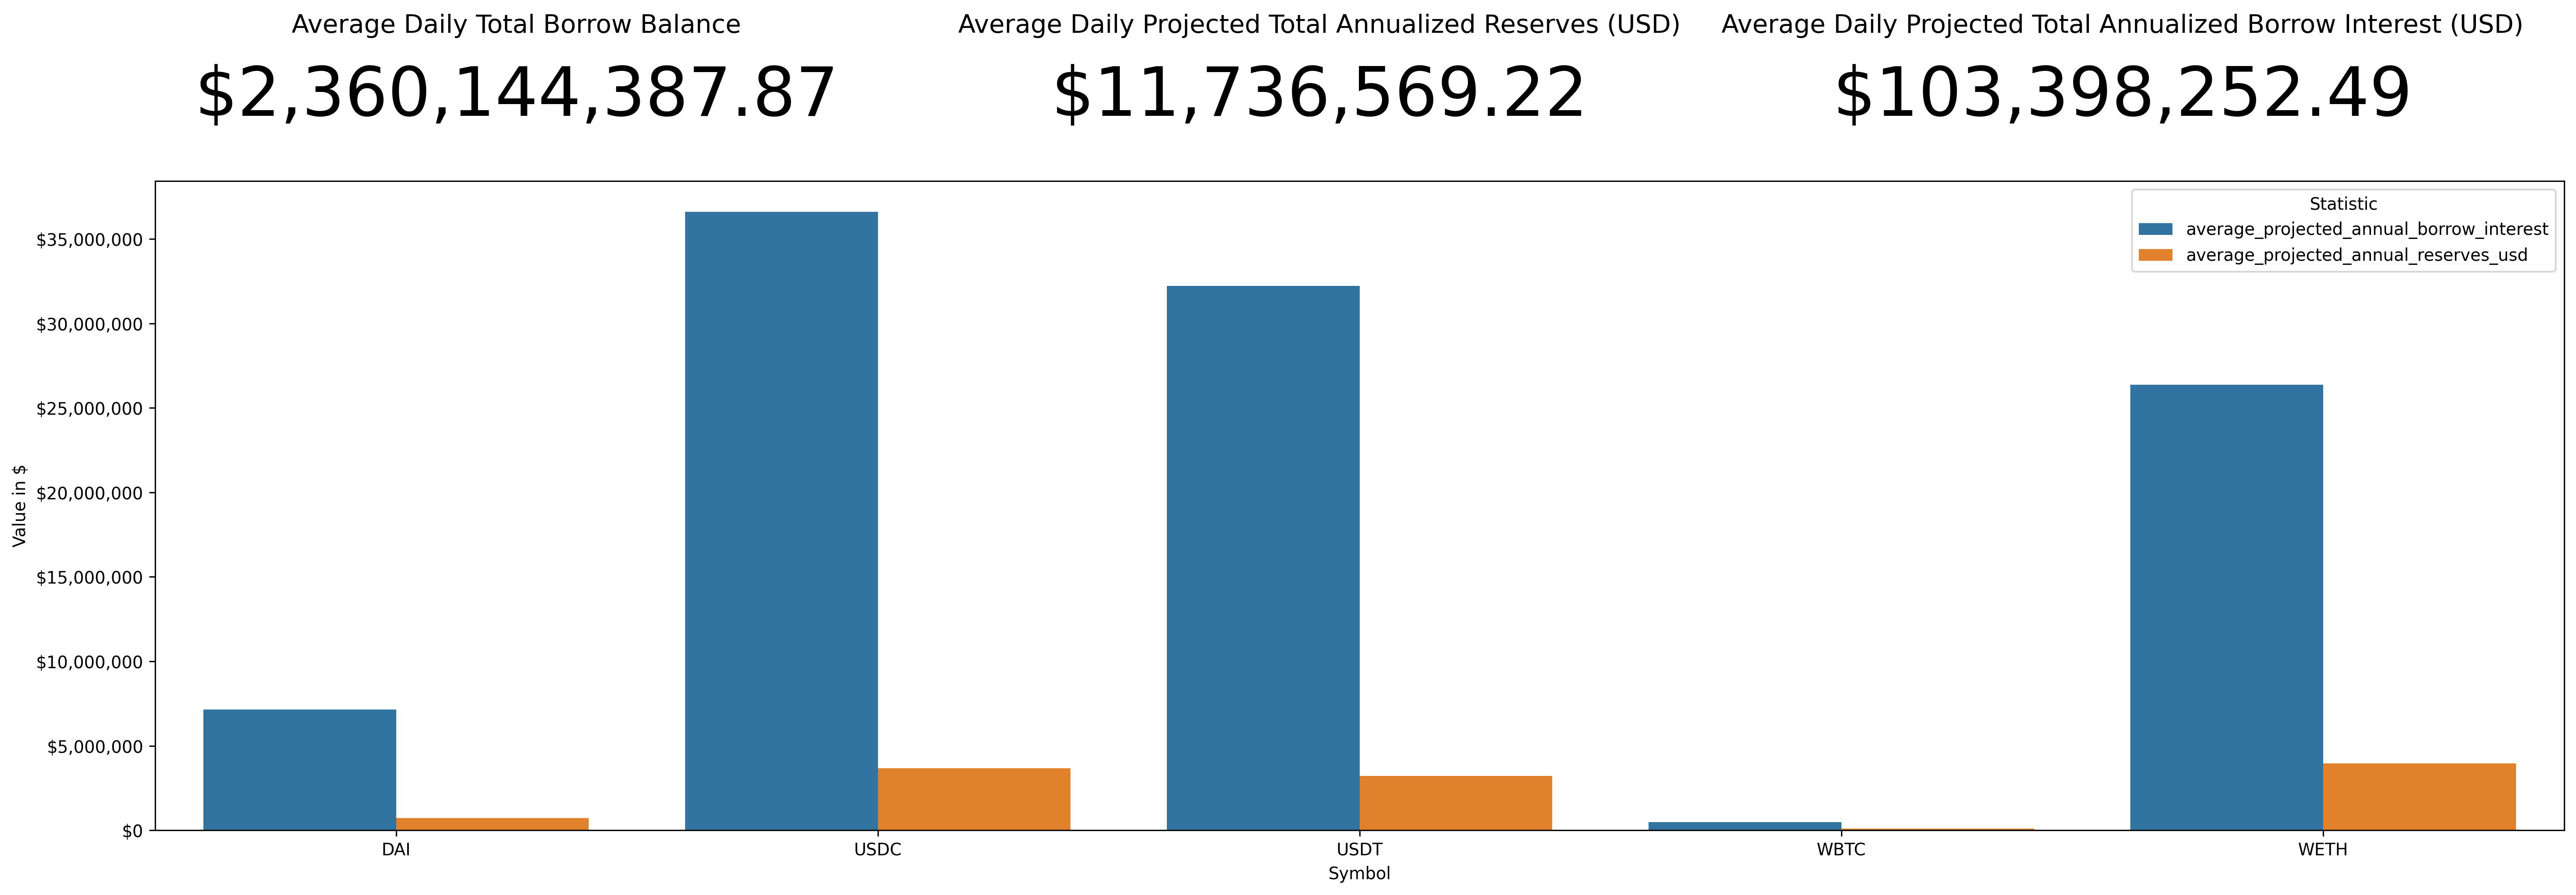
Weekly Annualized Reserve and Interest Projection
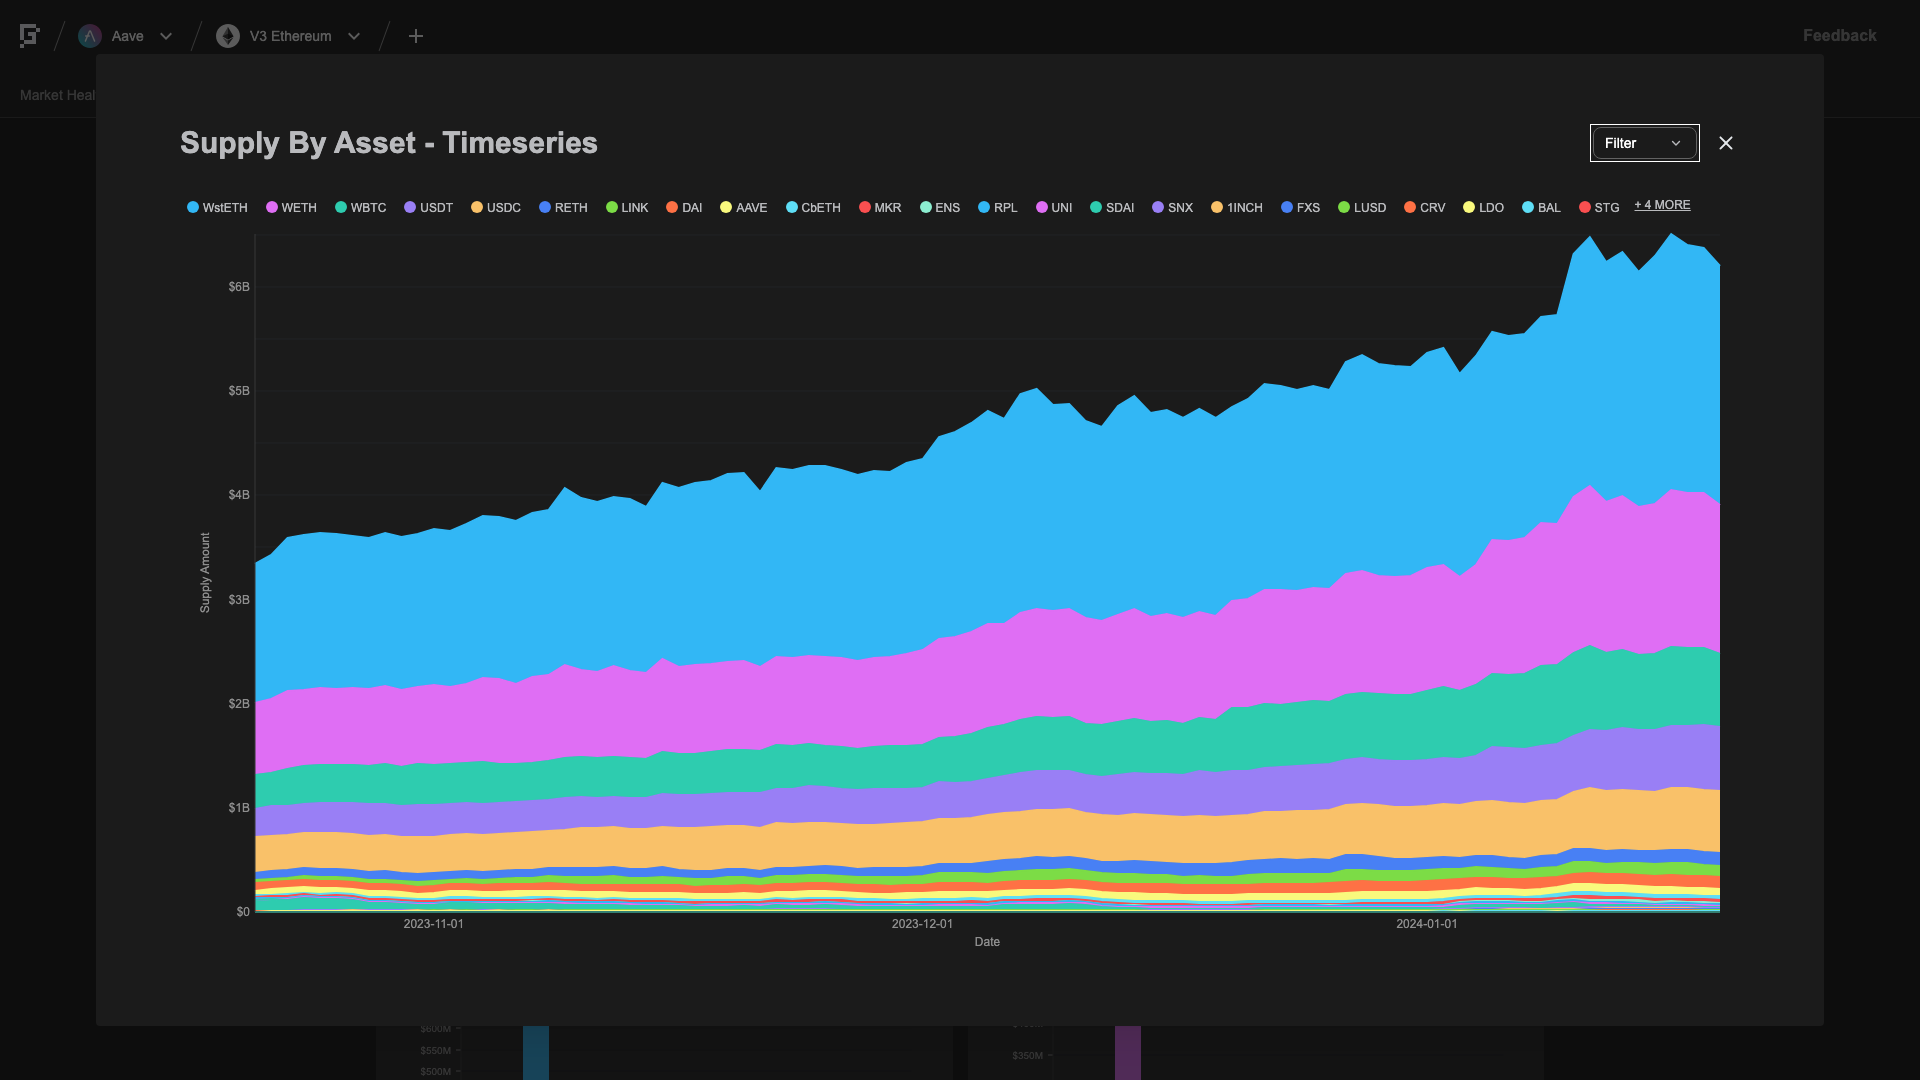
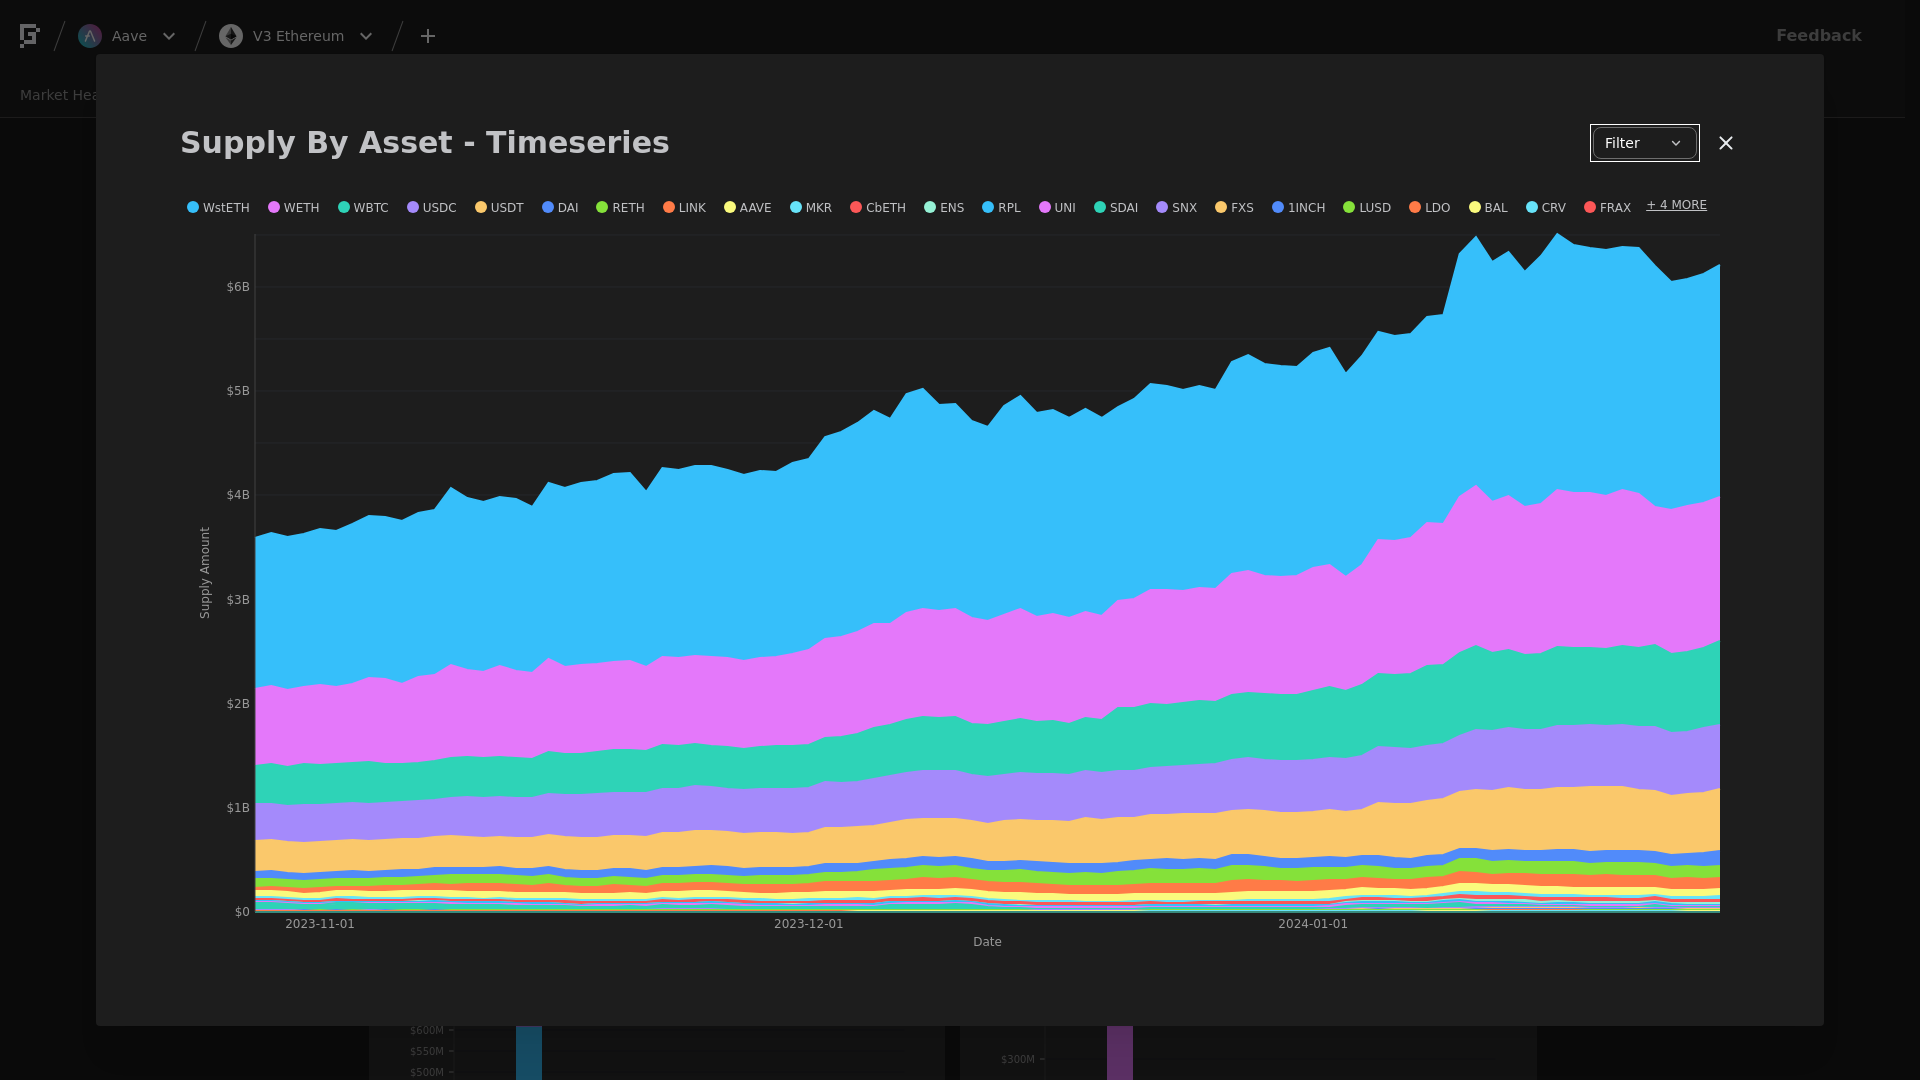
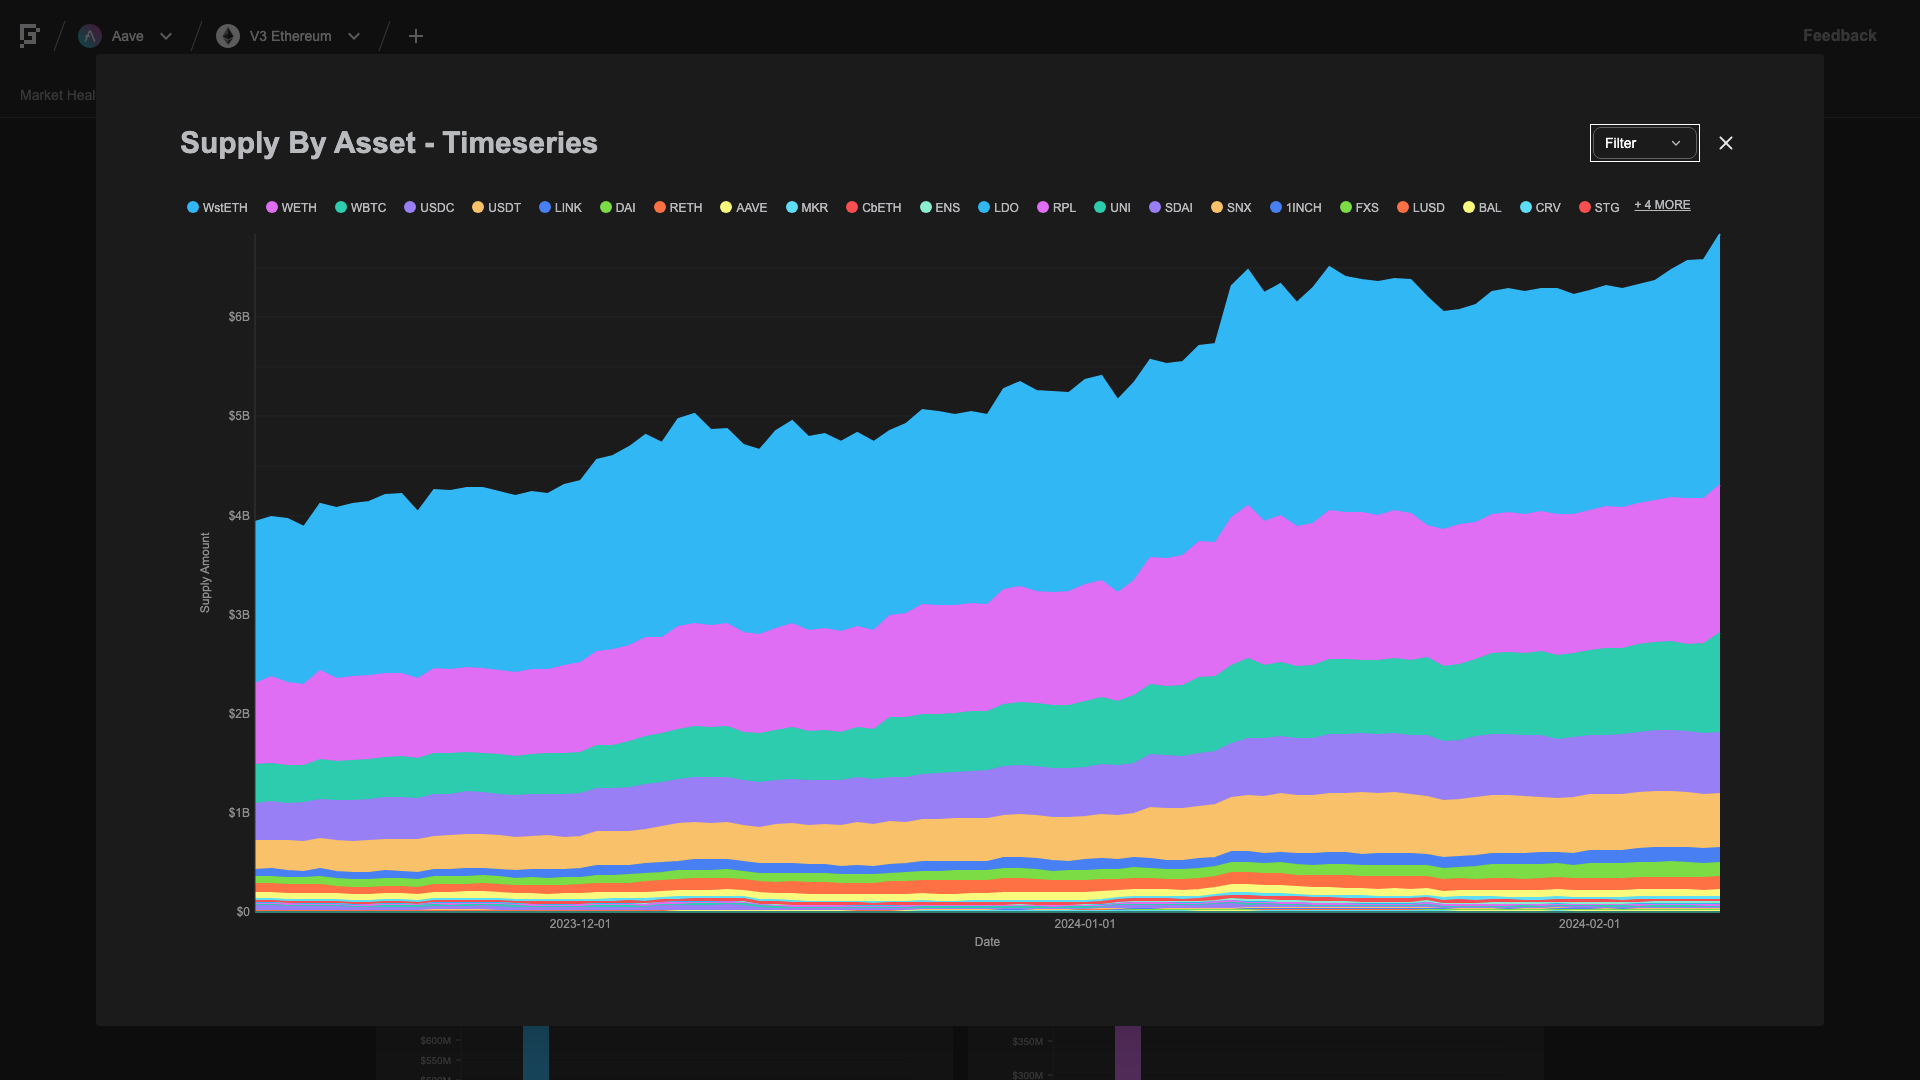
Supply Trend
This graph shows the total supply of all assets over the time frame in question. To see updated statistics, please see the live version of this graph here.
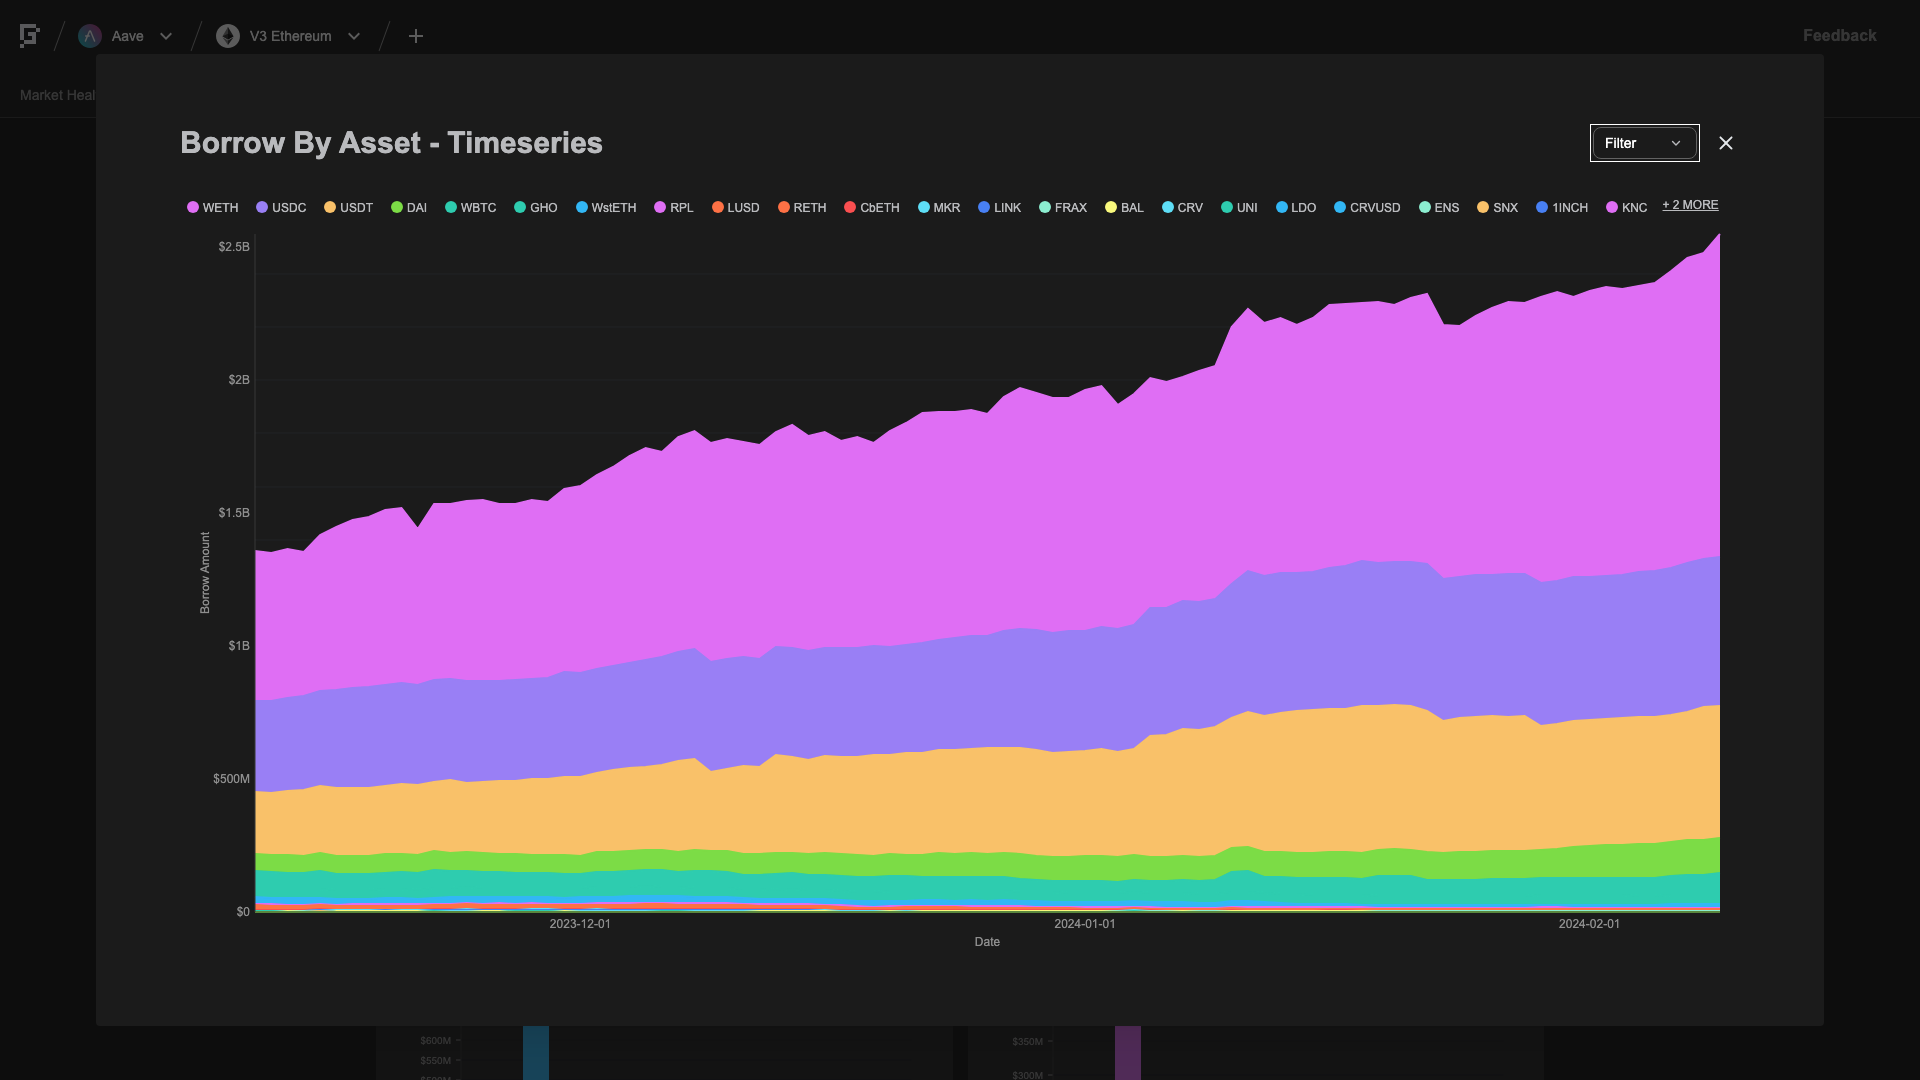
Borrows Trend
This graph shows the total borrows of all assets over the time frame in question.
To see updated statistics, please see the live version of this graph here.
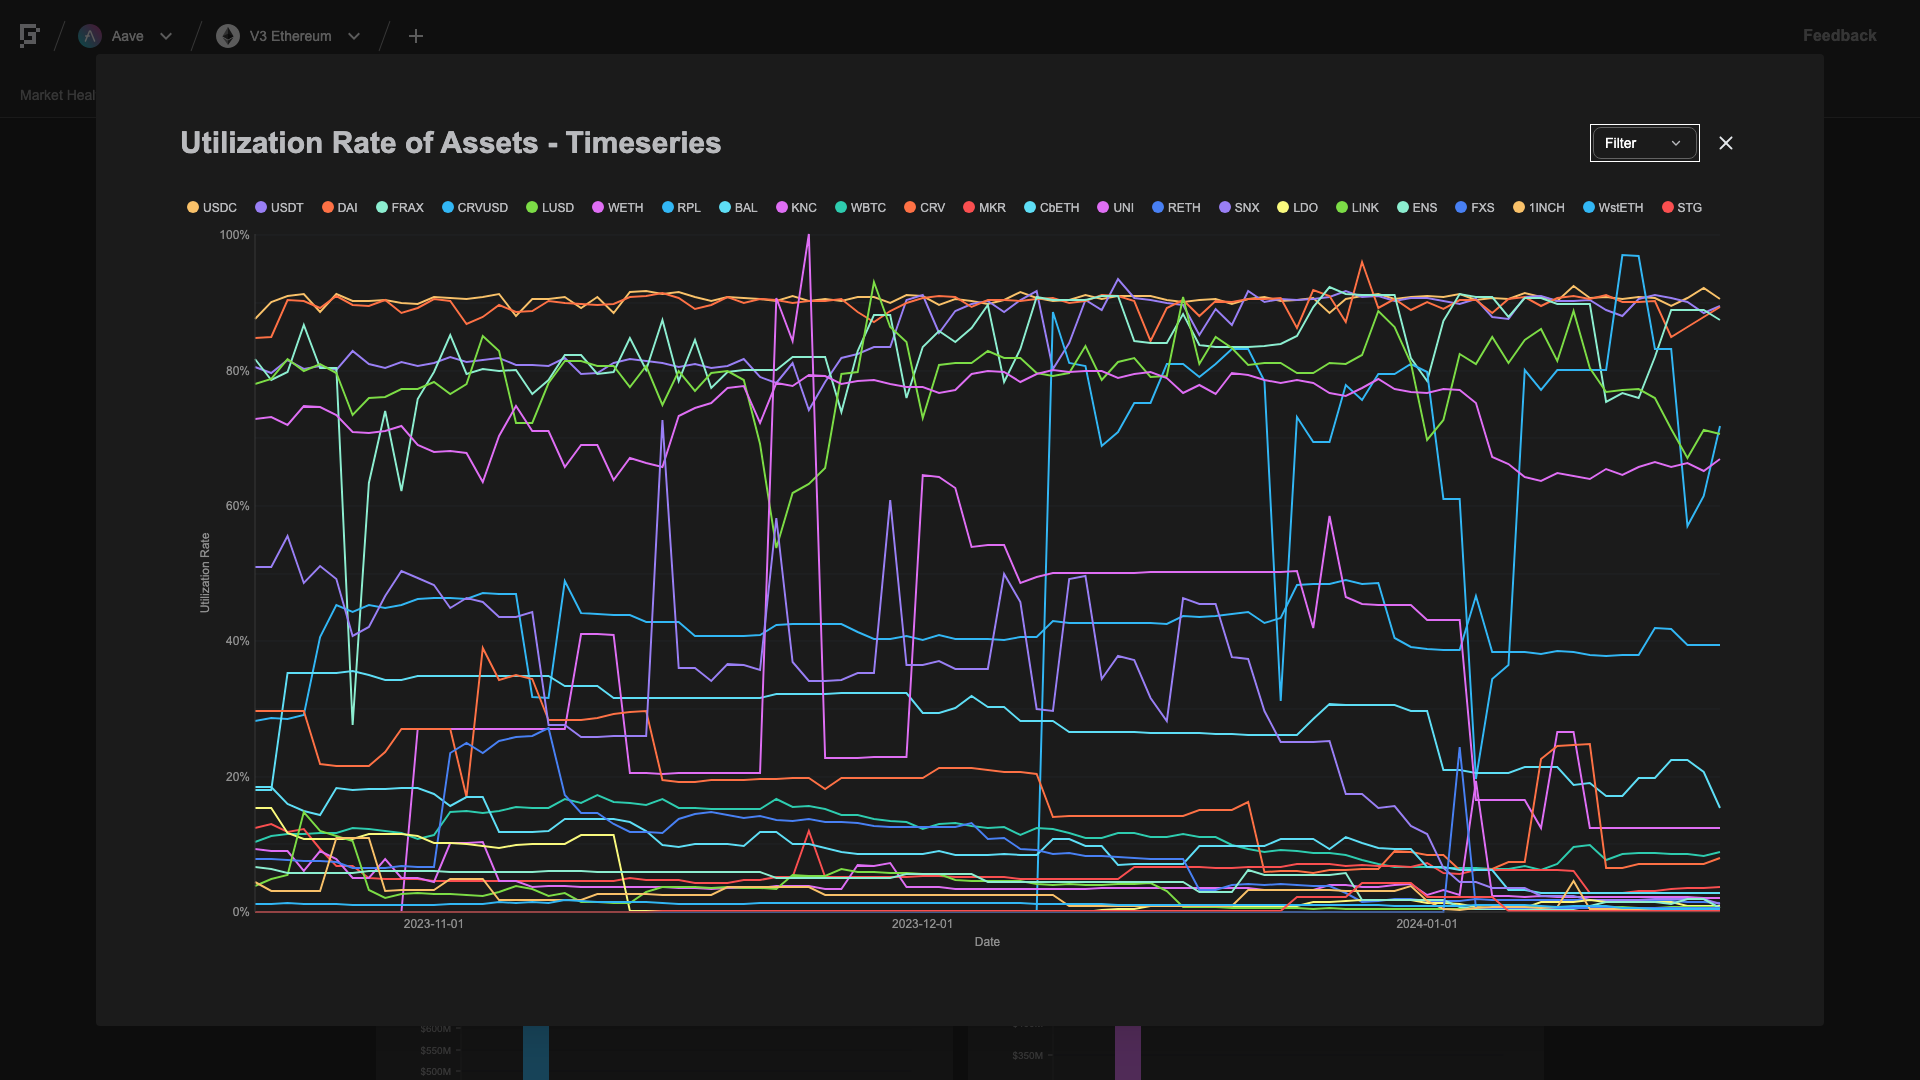
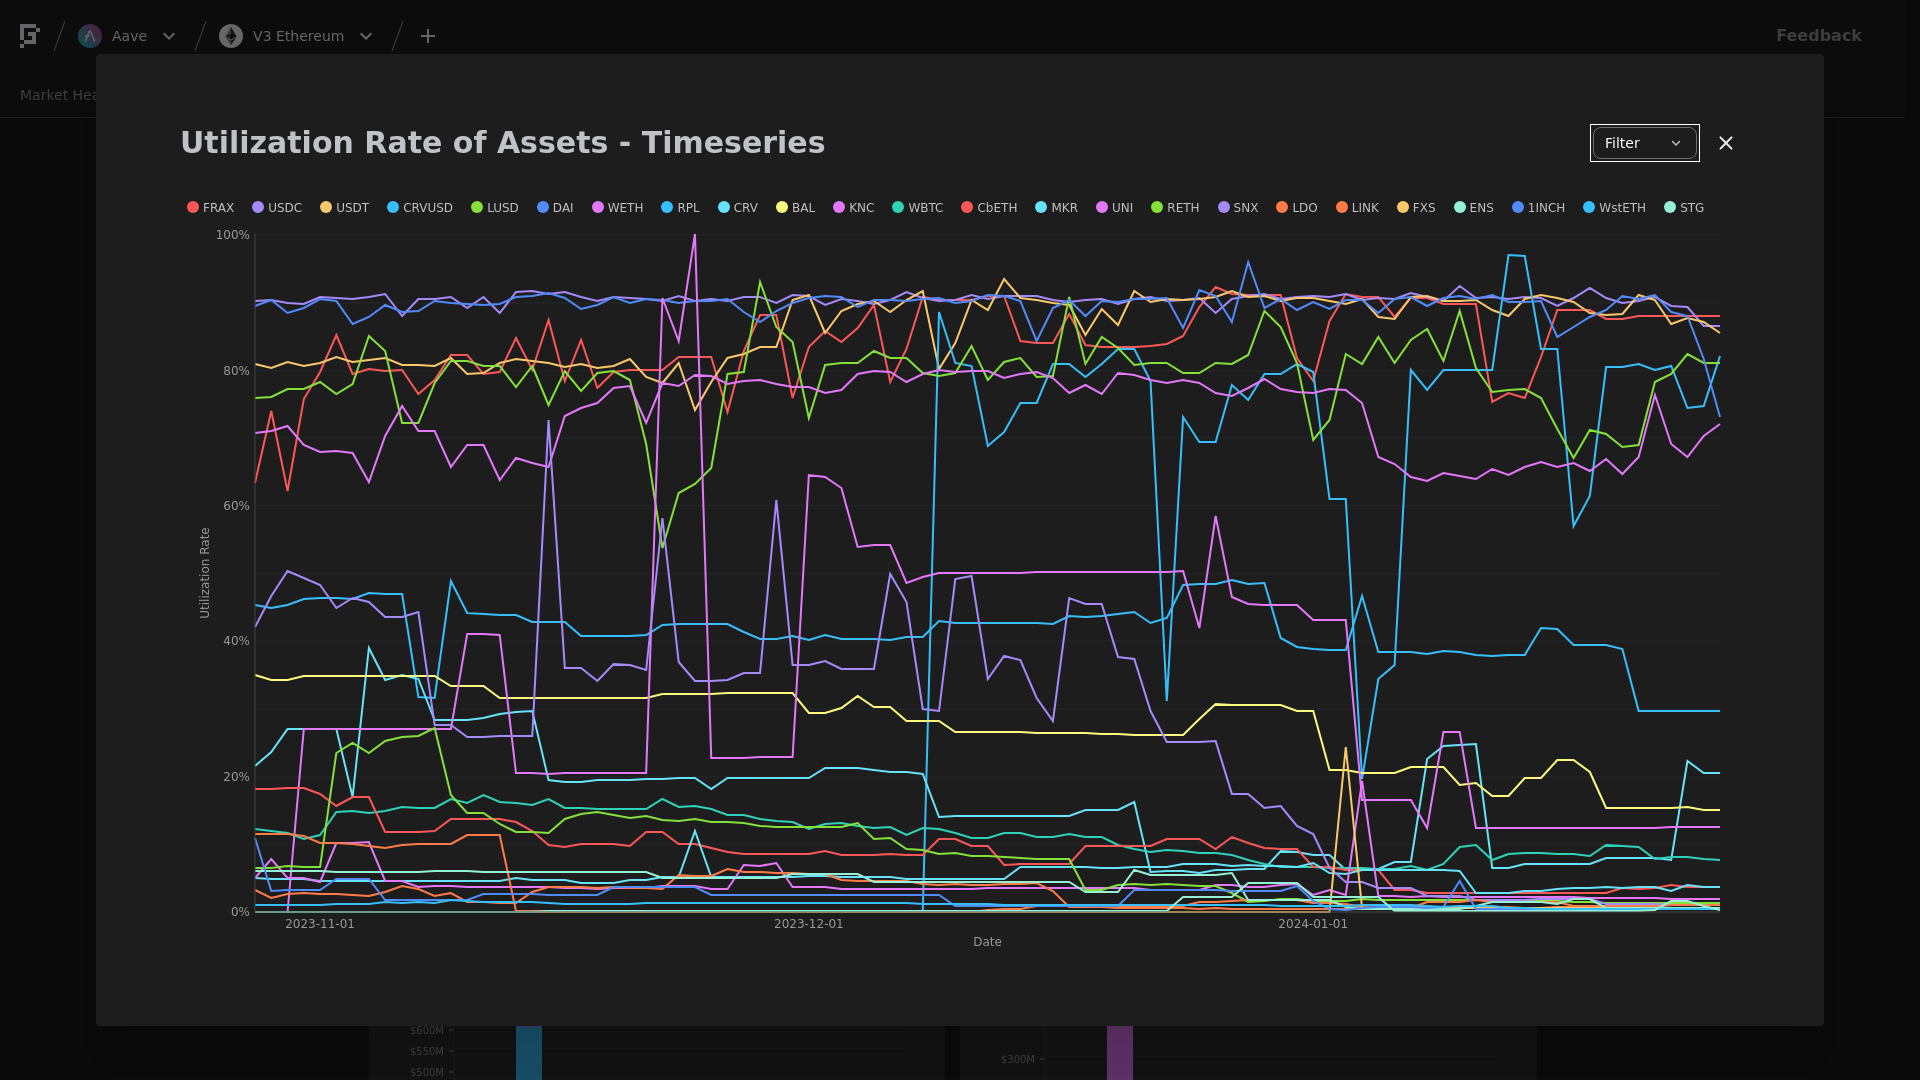
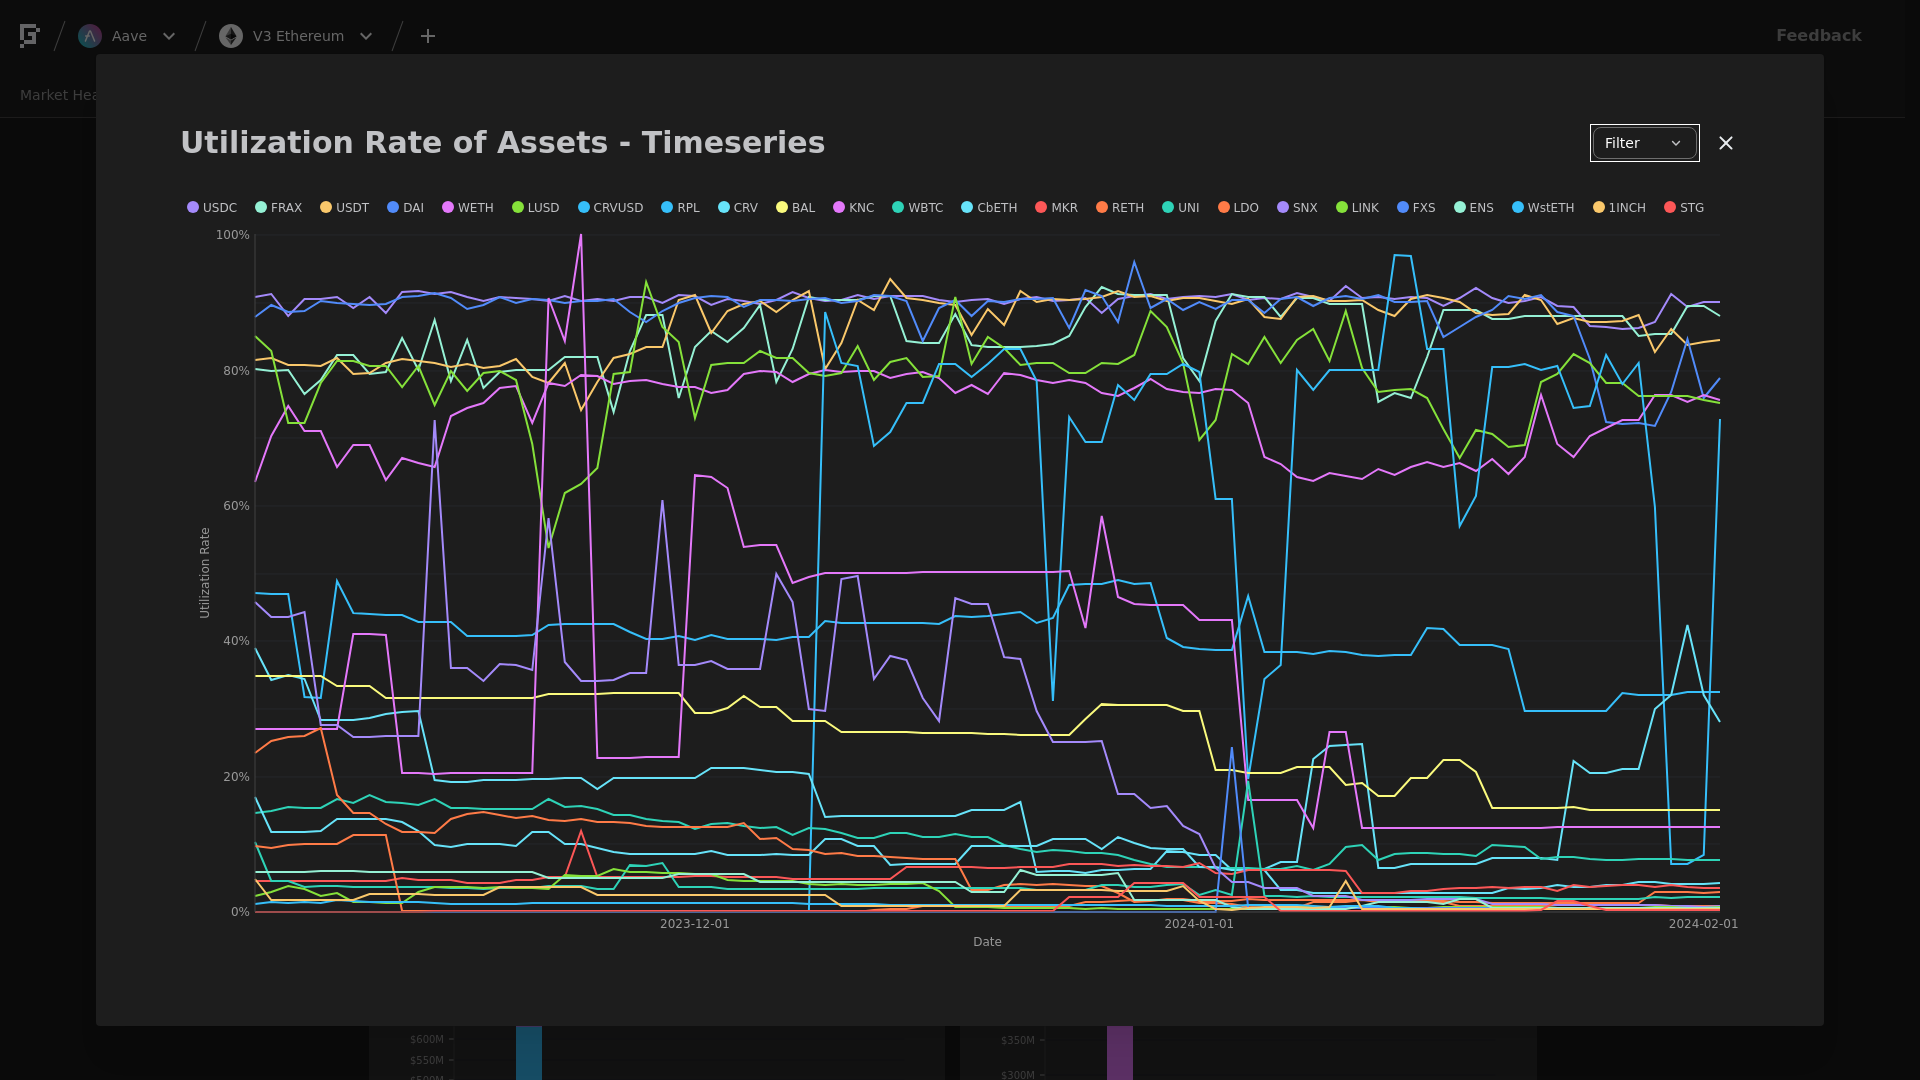
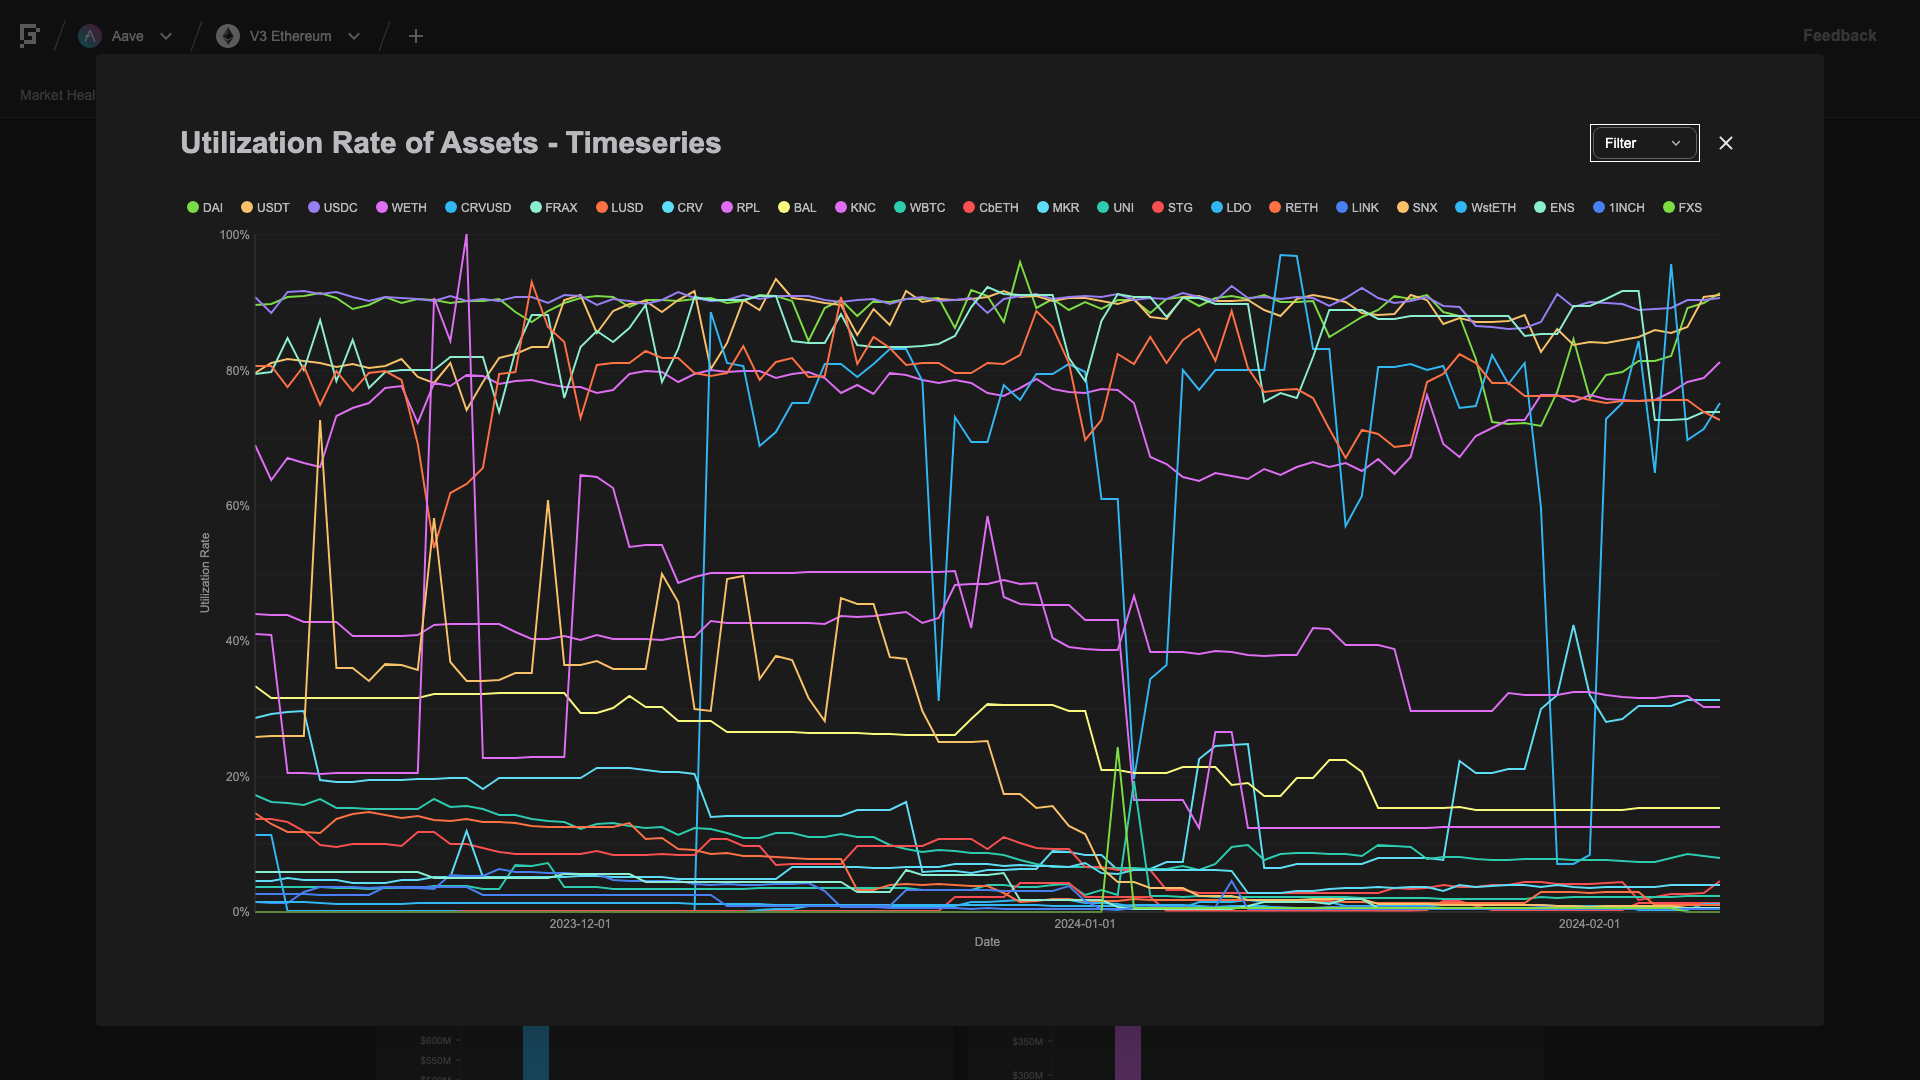
Utilization Trend
This graph shows the utilization (borrow / supply) of all assets over the time frame in question.
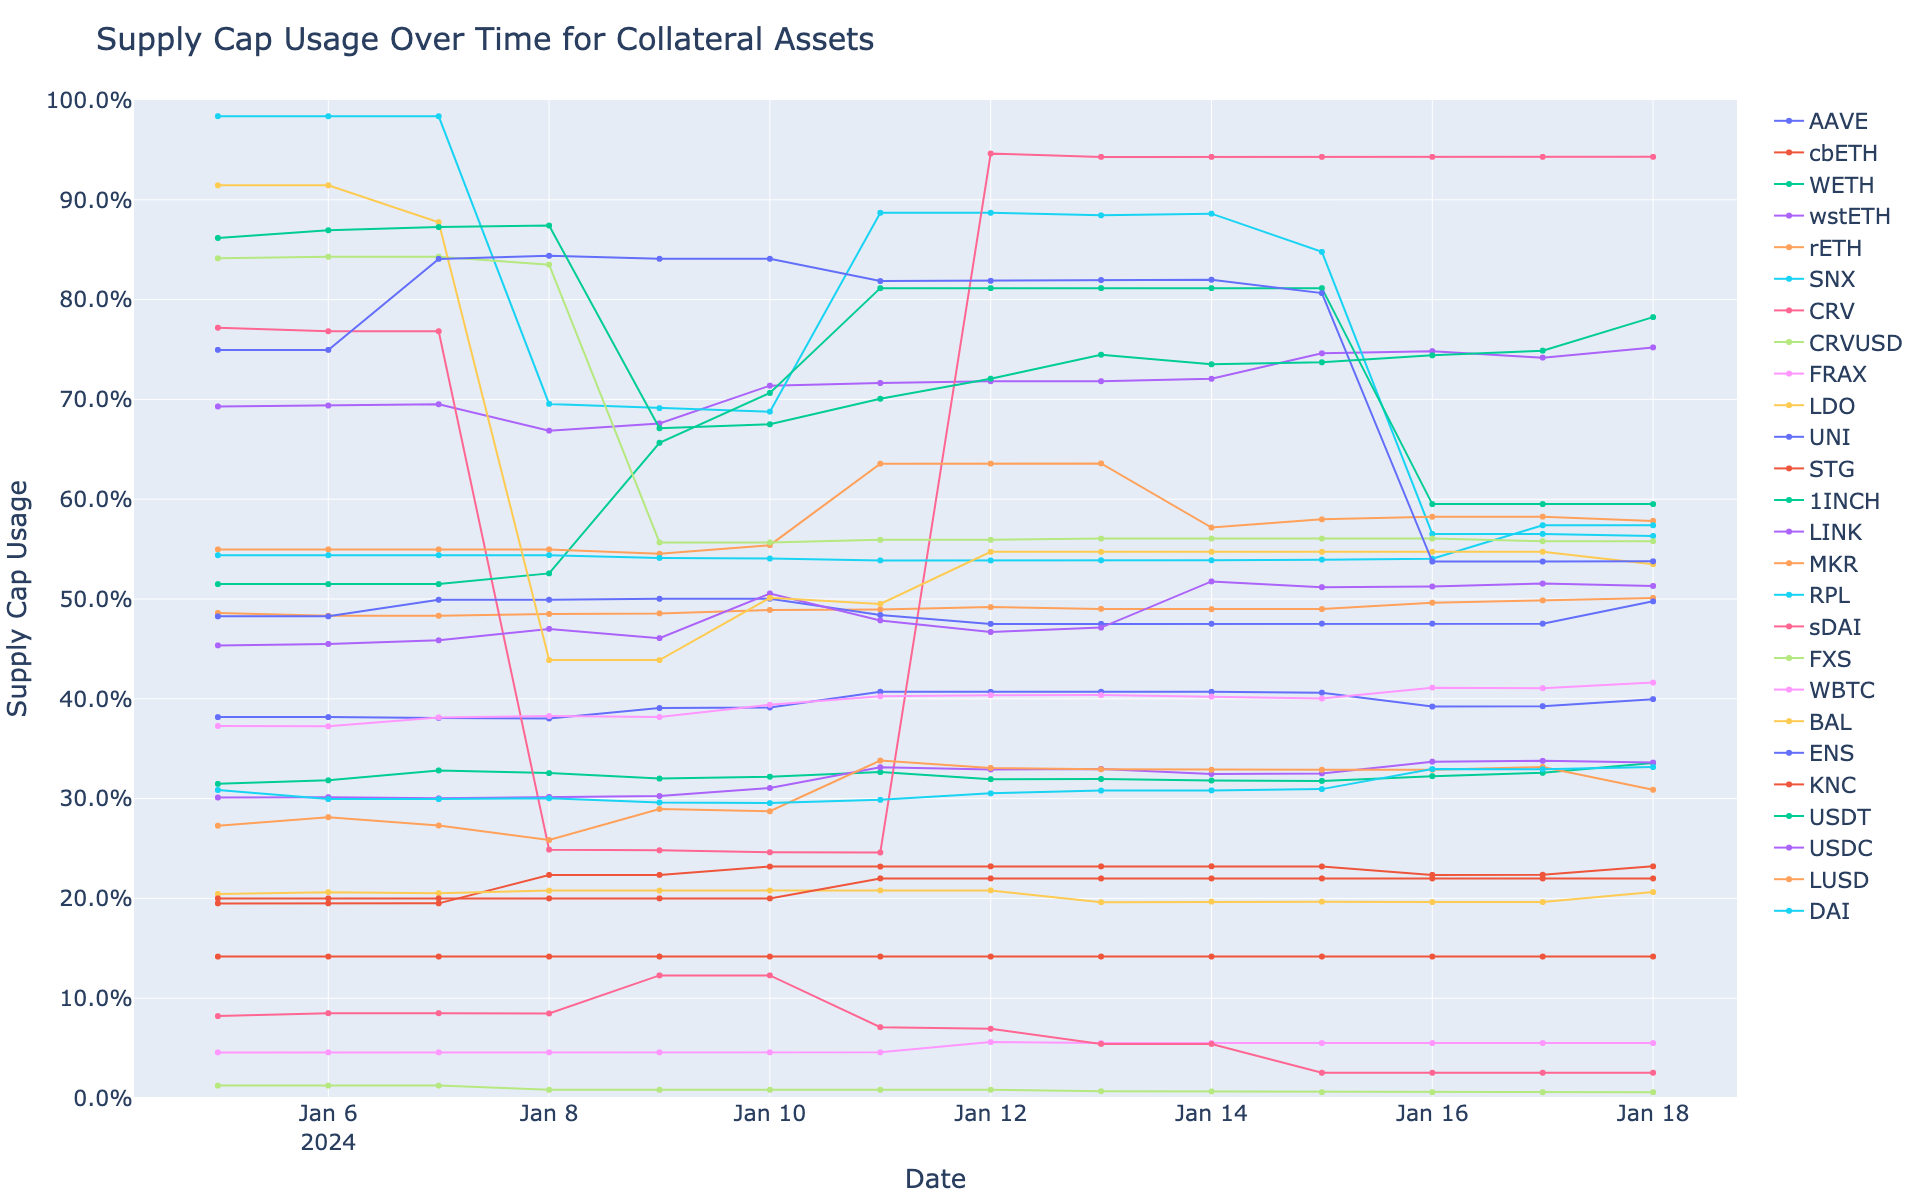
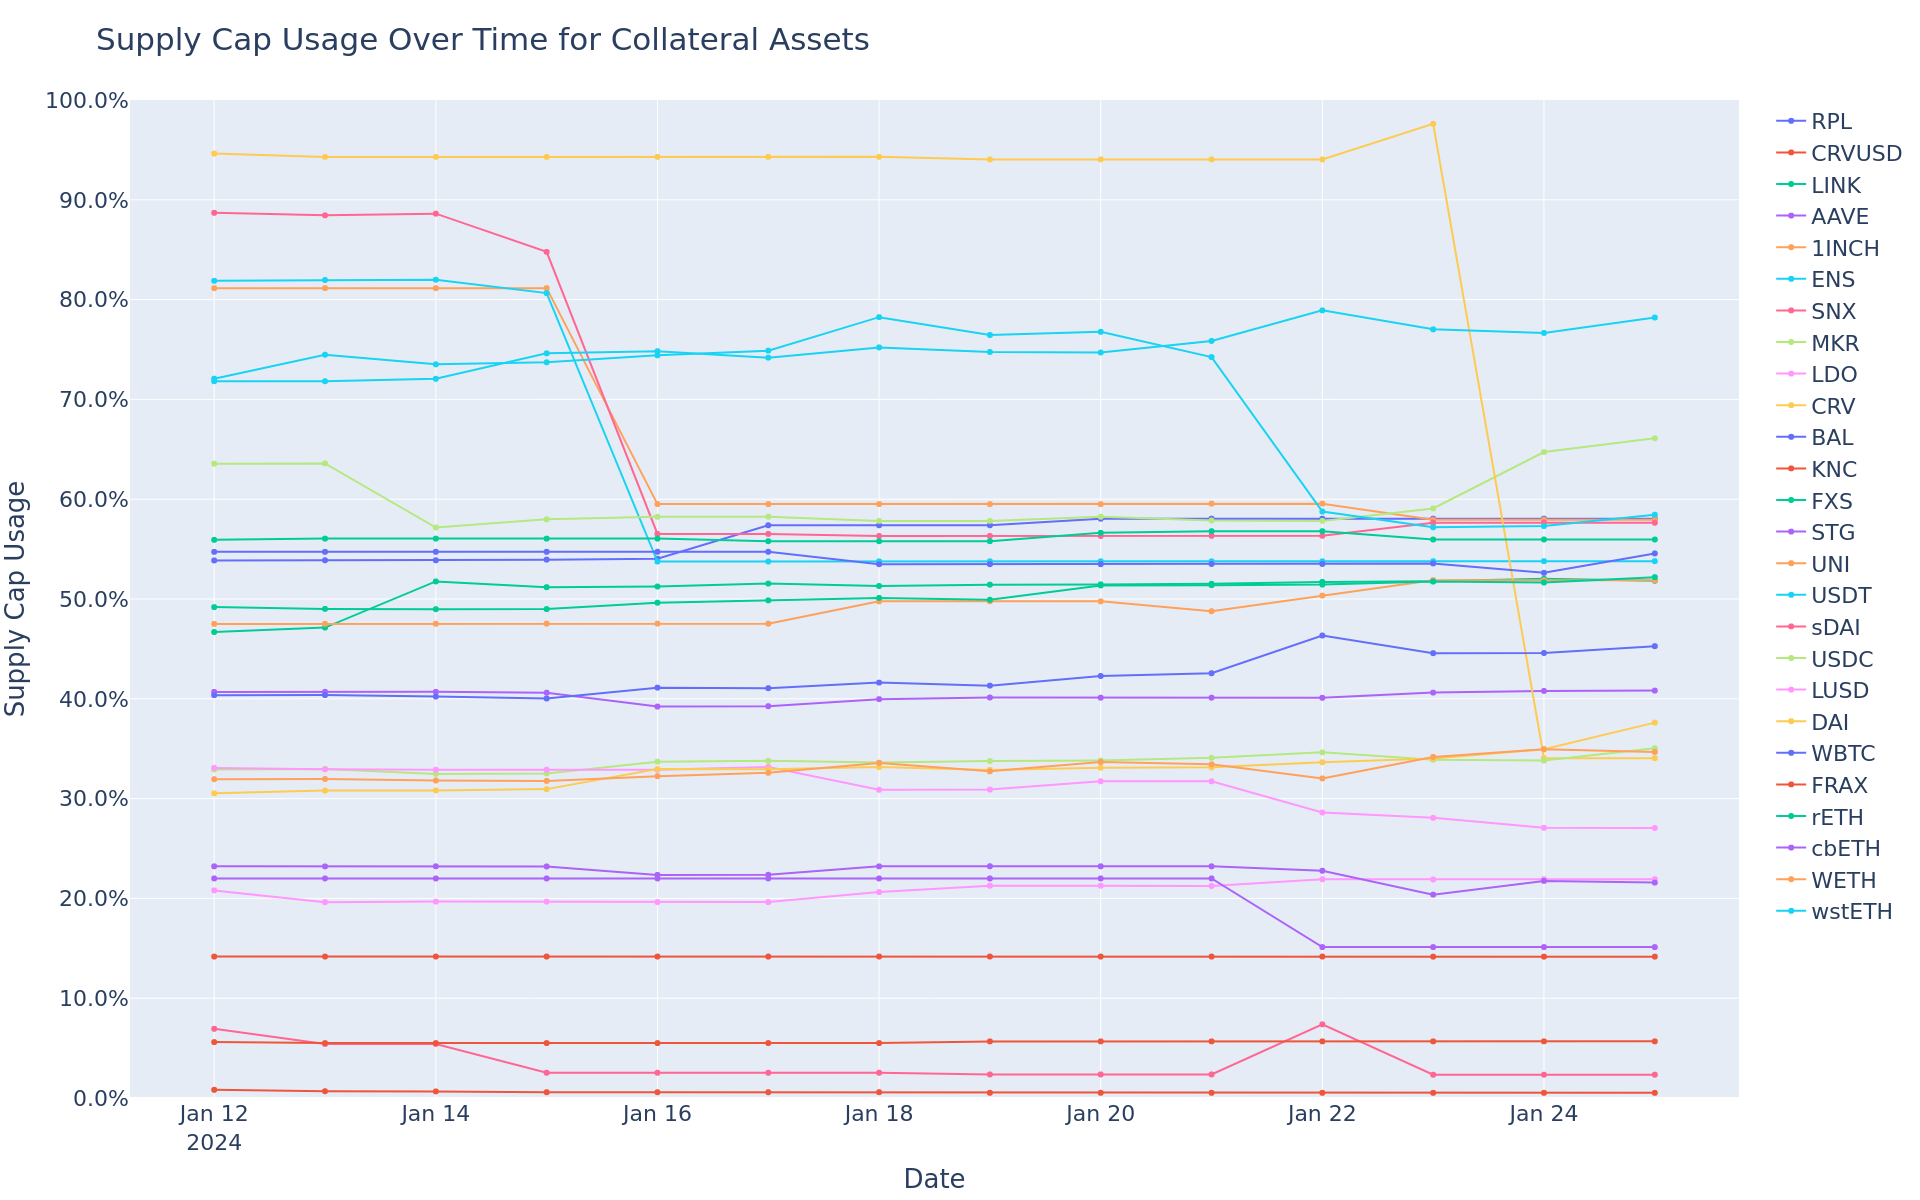
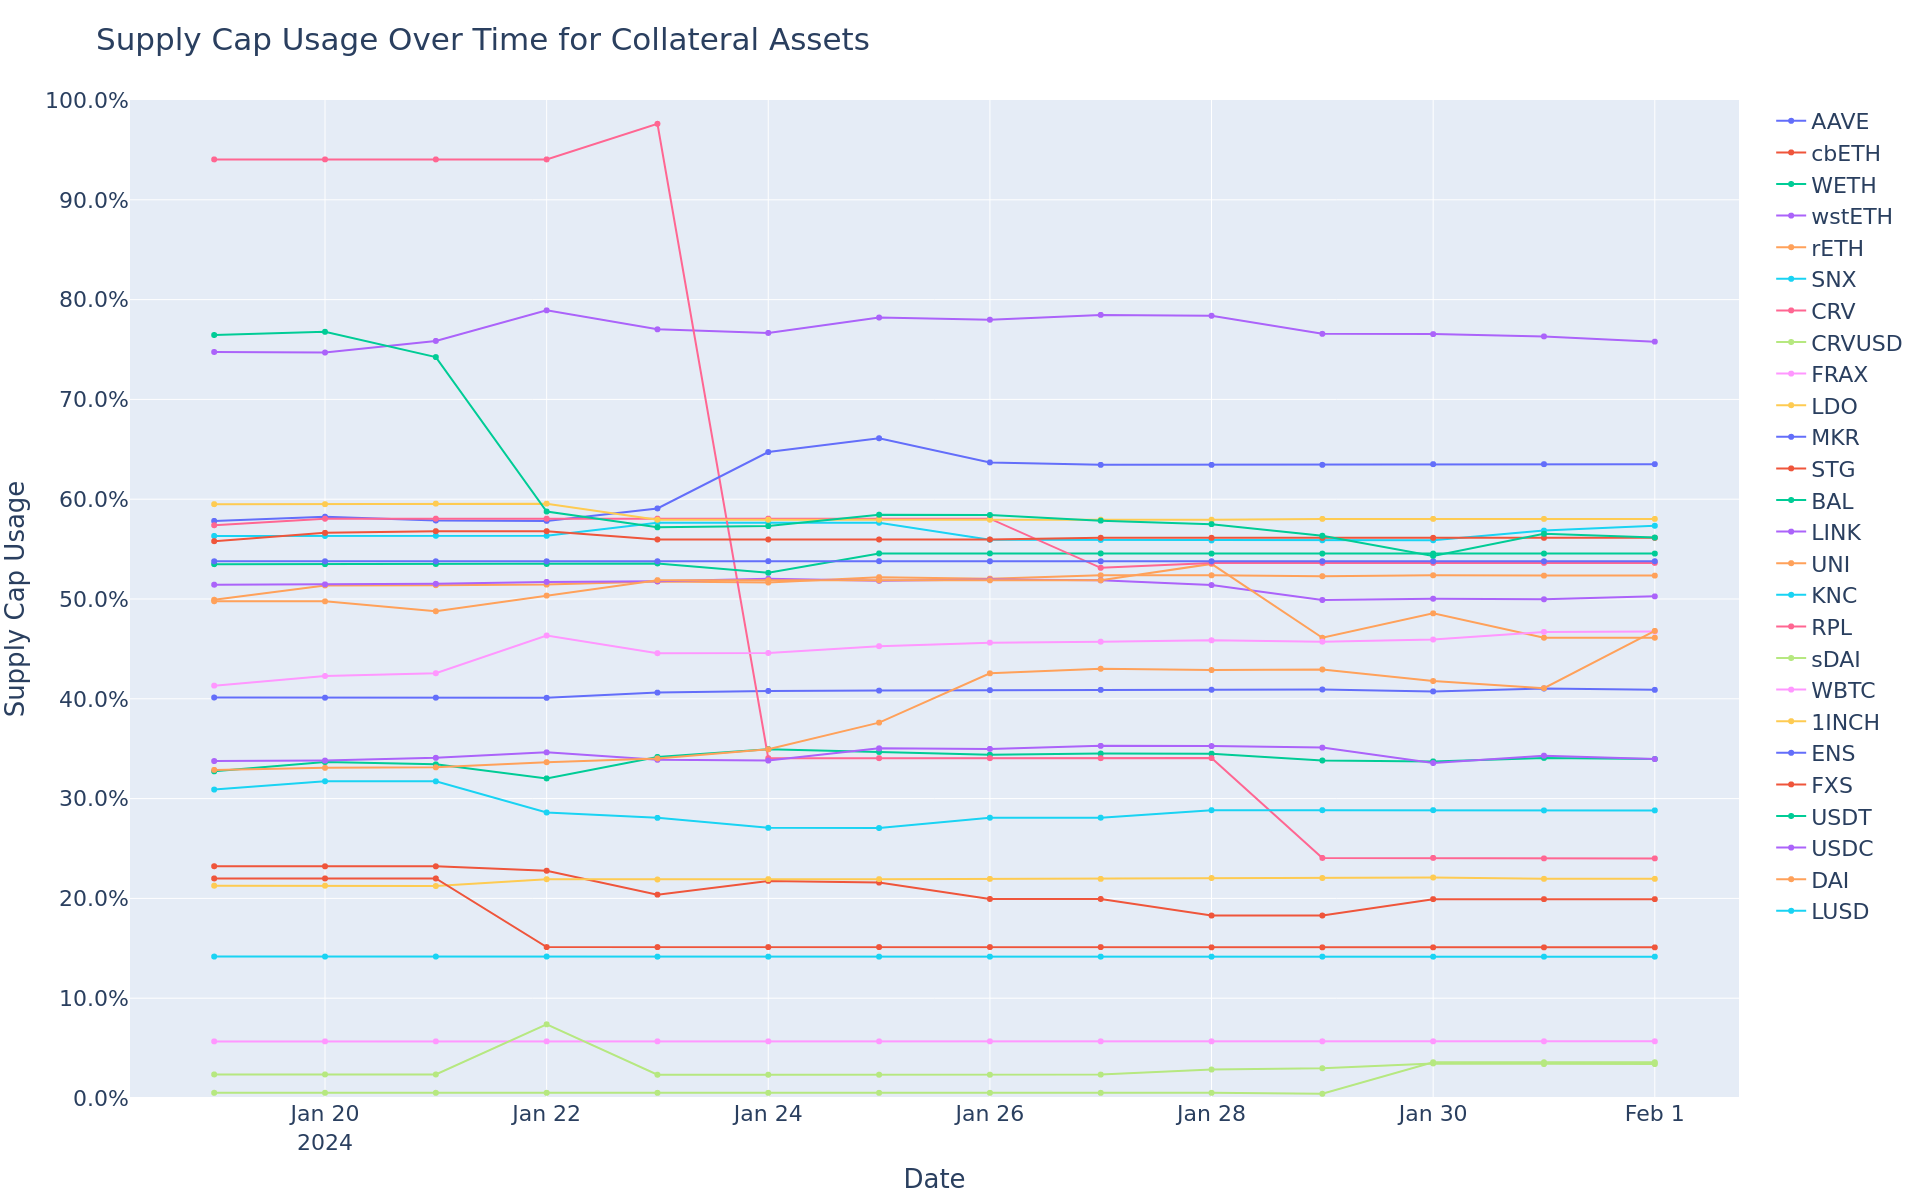
Supply Cap Usage Trend
This graph shows the supply cap usage (supply / supply cap) of all assets over the time frame in question.
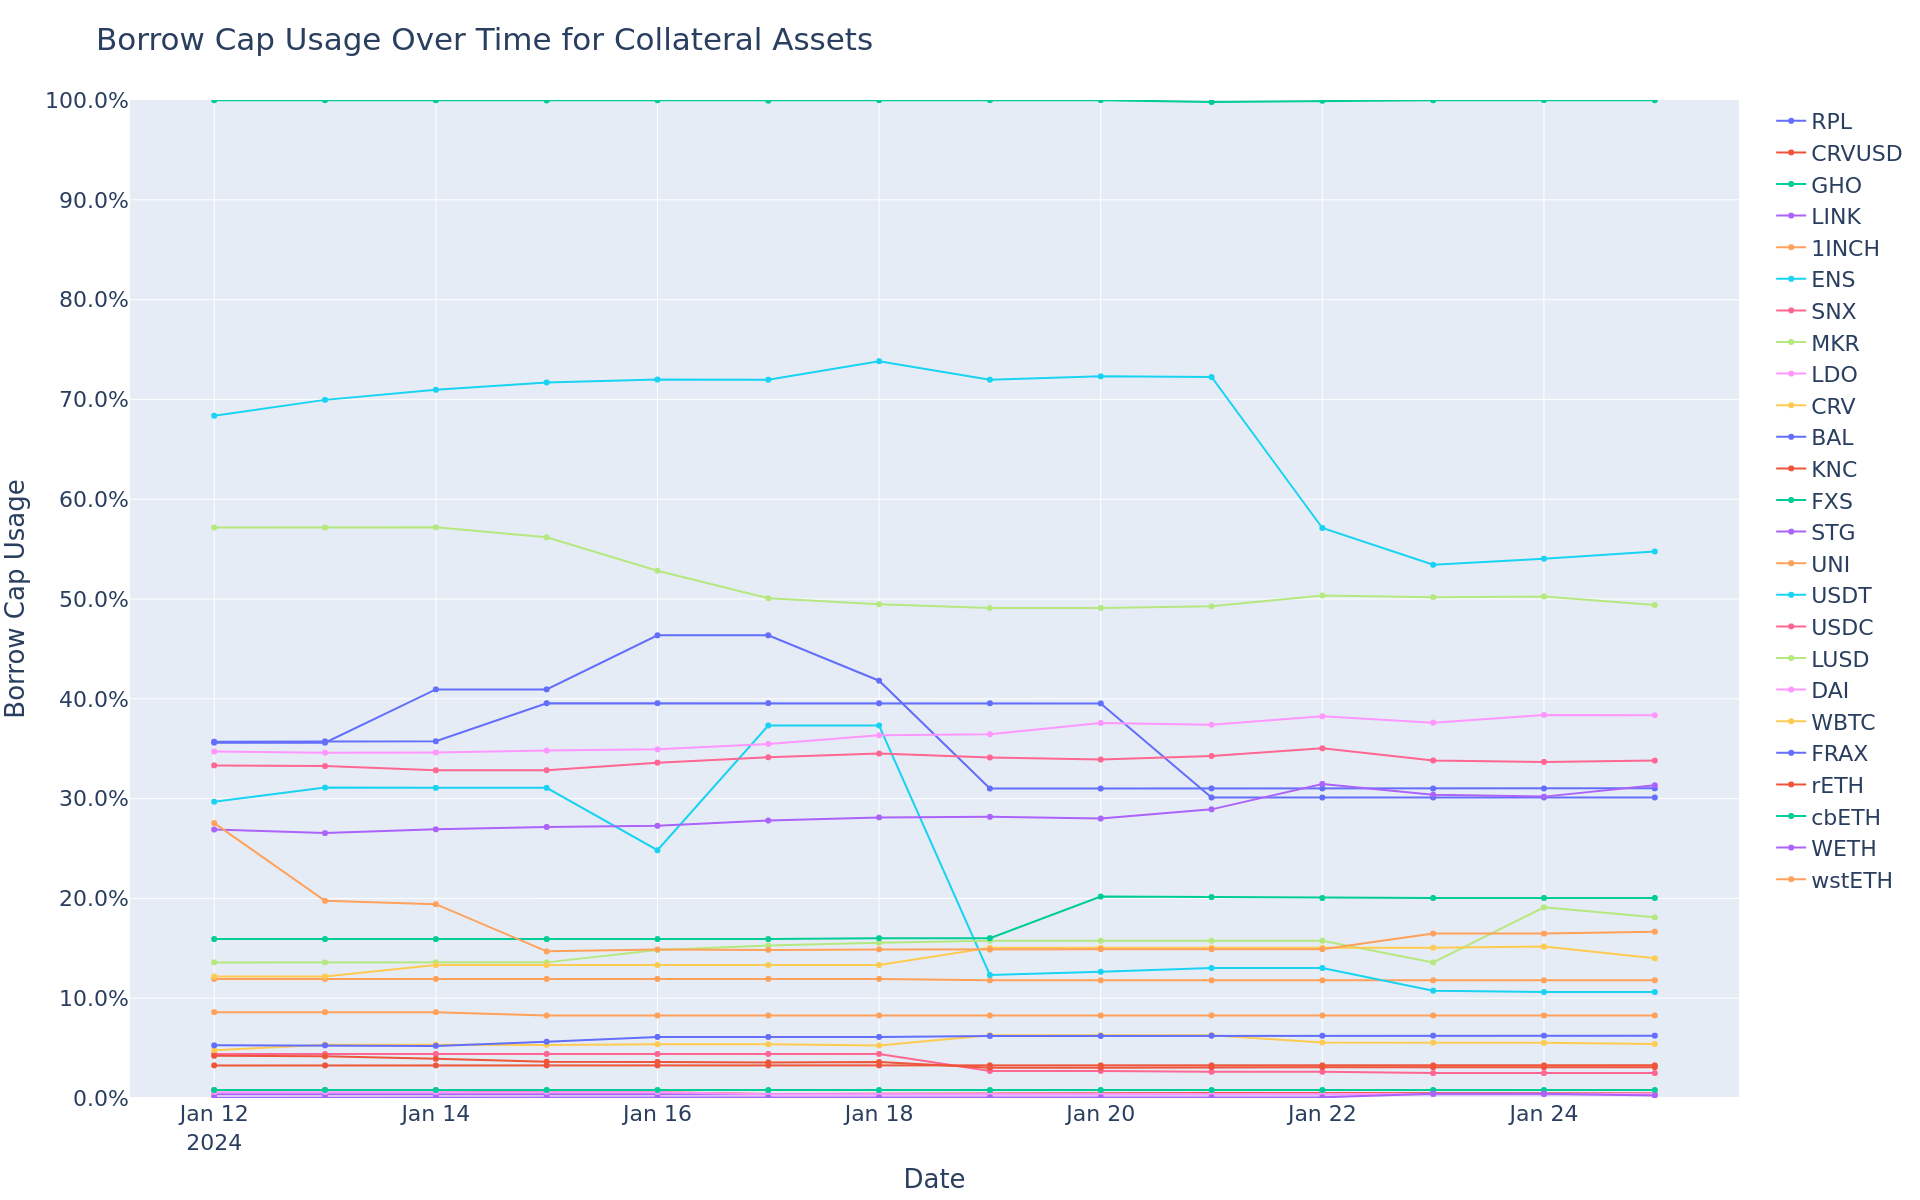
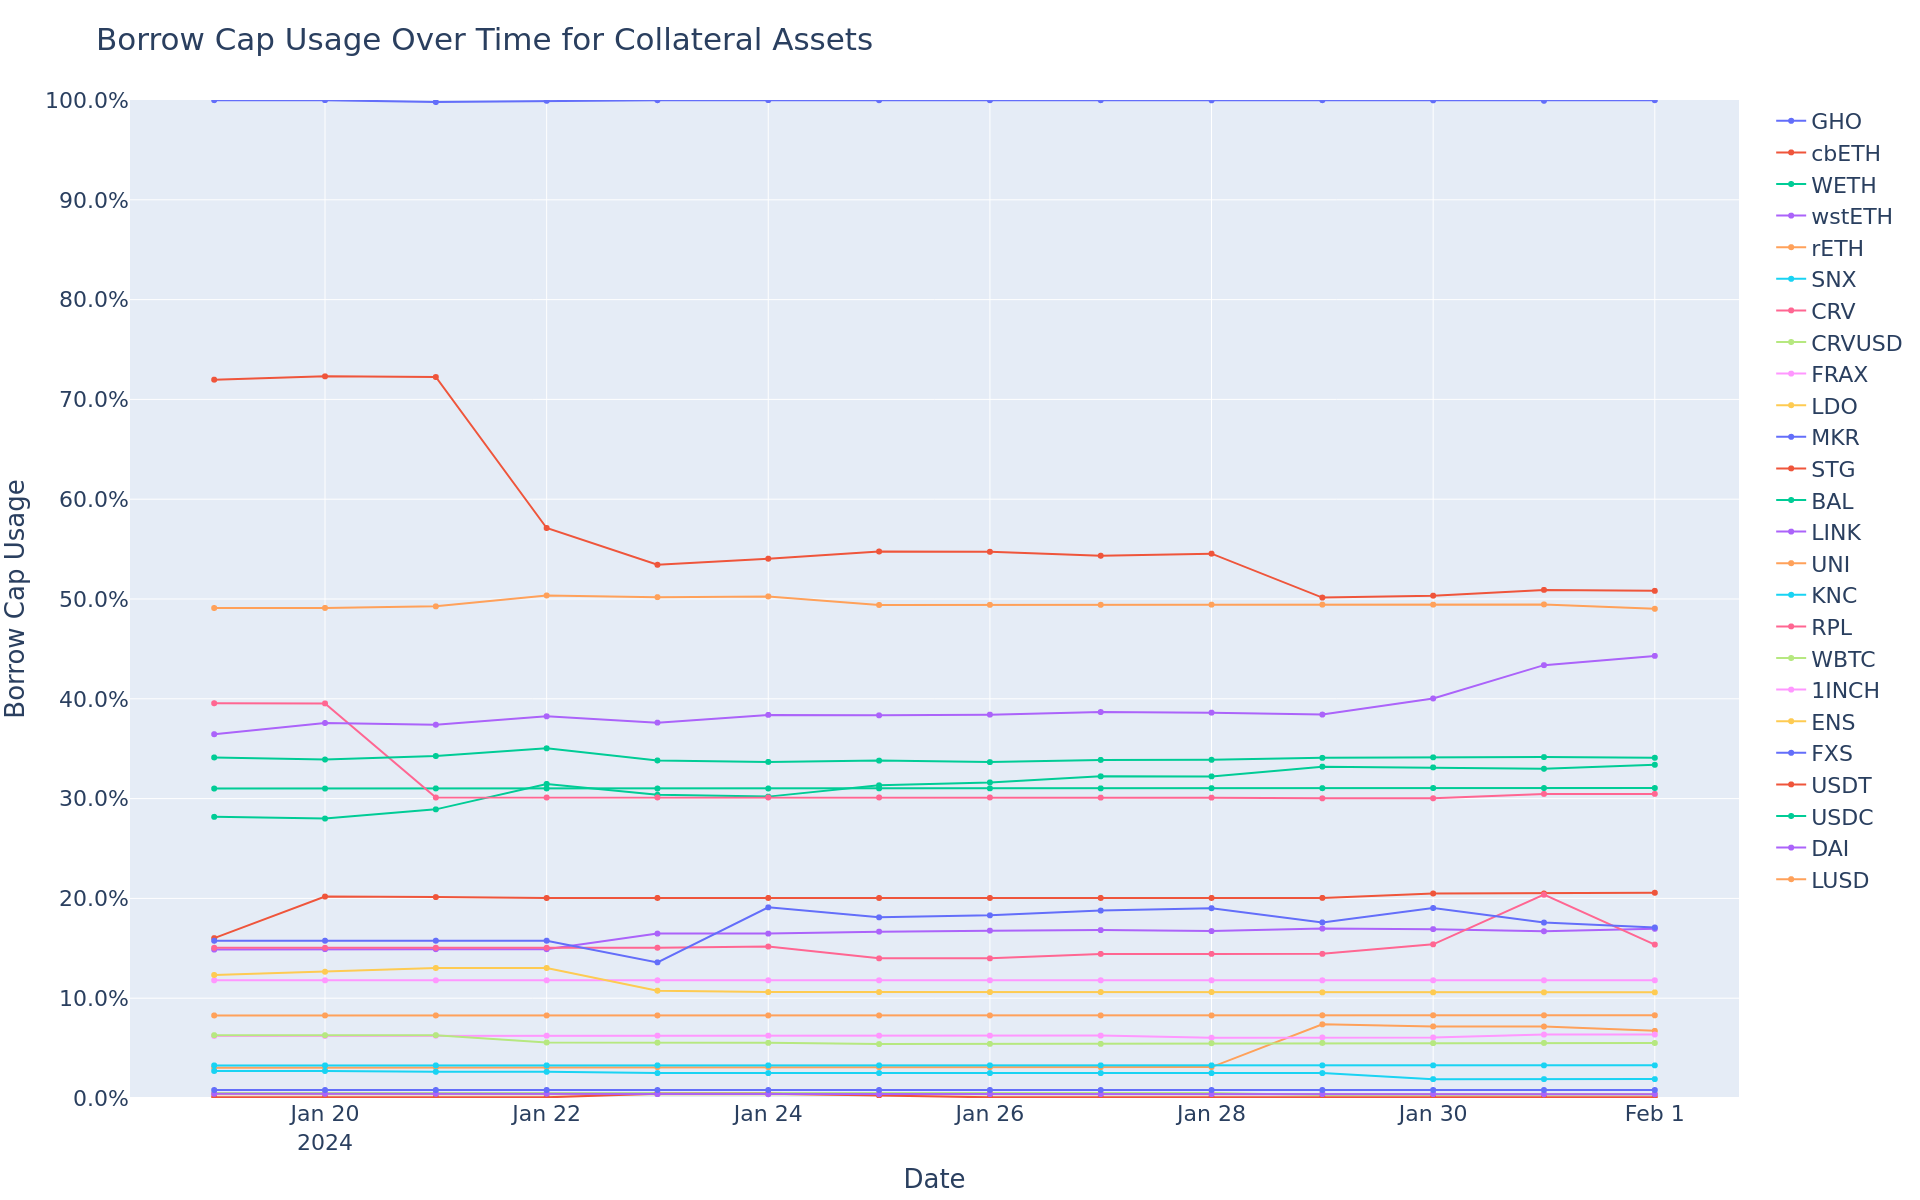
Borrow Cap Usage Trend
This graph shows the borrow cap usage (borrow / borrow cap) of all assets over the time frame in question.
[Gauntlet] Weekly Market Update - (2024-01-26 through 2024-02-01)
Gauntlet would like to provide the community with an update on this market over the previous week. Gauntlet is continuing to monitor this market. At this time, we do not recommend any parameter updates, but will keep the community informed.
Summary
This table gives high-level statistics over the time frame in question. Bold lines correspond to weekly average supply cap usage over 75%.
rETH’s borrow balance increased WoW by 126% from $1M to $3M.
STG’s borrow balance decreased WoW by -72% from $7K to $2K.
CRVUSD’s supply balance increased WoW by 592% from $310K to $2M.
rETH’s utilization increased WoW by 117% from 1% to 3%.
CRVUSD’s utilization decreased WoW by -89% from 75% to 8%.
Weekly Annualized Reserve and Interest Projections
Supply Trend
This graph shows the total supply of all assets over the time frame in question. To see updated statistics, please see the live version of this graph here.
Borrows Trend
This graph shows the total borrows of all assets over the time frame in question. To see updated statistics, please see the live version of this graph here.
Utilization Trend
This graph shows the utilization (borrow / supply) of all assets over the time frame in question.
Supply Cap Usage Trend
This graph shows the supply cap usage (supply / supply cap) of all assets over the time frame in question.
Borrow Cap Usage Trend
This graph shows the borrow cap usage (borrow / borrow cap) of all assets over the time frame in question.
STG’s borrow balance increased WoW by 458% from $2K to $10K.
rETH’s borrow balance decreased WoW by -59% from $3M to $1M.
LDO’s supply balance increased WoW by 274% from $4M to $14M.
CRVUSD’s utilization increased WoW by 746% from 8% to 71%.
Liquidations
Liquidated Asset
Liquidated Amount (Tokens)
Liquidated Amount (USD)
WETH
69.38
$160.96K
LINK
2.36K
$43.27K
USDC
5.29K
$5.29K
Weekly Annualized Reserve and Interest Projections
Supply Trend
This graph shows the total supply of all assets over the time frame in question. To see updated statistics, please see the live version of this graph here.
Borrows Trend
This graph shows the total borrows of all assets over the time frame in question. To see updated statistics, please see the live version of this graph here.
Utilization Trend
This graph shows the utilization (borrow / supply) of all assets over the time frame in question.
Supply Cap Usage Trend
This graph shows the supply cap usage (supply / supply cap) of all assets over the time frame in question.
Borrow Cap Usage Trend
This graph shows the borrow cap usage (borrow / borrow cap) of all assets over the time frame in question.
[Gauntlet] Weekly Market Update - (2024-02-09 through 2024-02-15)
Gauntlet would like to provide the community with an update on this market over the previous week. Gauntlet is continuing to monitor this market. At this time, we do not recommend any parameter updates, but will keep the community informed.
Summary
This table gives high-level statistics over the time frame in question. Bold lines correspond to weekly average supply/borrow cap usage over 75%.
note:
Gauntlet has decided to withhold its recommendation to increase the supply cap for LDO our of LDO liquidity concerns.
Asset
Current Borrow Cap
Current Supply Cap
Average Borrow Cap Usage (Past Week)
Average Supply Cap Usage (Past Week)
Average Utilization
Current DEX 25% Slippage (USD)
USDC
1.58B
1.76B
36.37%
35.93%
90.87%
$147.44M
USDT
930.00M
1.00B
54.39%
55.66%
90.89%
$374.29M
DAI
271.00M
338.00M
44.70%
39.58%
90.56%
$134.44M
CRVUSD
50.00M
60.00M
0.28%
0.29%
80.88%
$37.88M
LINK
13.00M
15.00M
0.39%
52.02%
0.65%
$24.70M
FRAX
12.00M
15.00M
5.23%
4.95%
84.47%
$60.13M
PYUSD
9.00M
10.00M
2.93%
37.51%
7.04%
$79.15M
LUSD
8.00M
18.00M
50.08%
29.10%
76.48%
$6.75M
STG
5.50M
10.00M
0.40%
15.09%
1.47%
$6.97M
CRV
5.00M
10.00M
17.60%
27.03%
32.55%
$2.04M
LDO
3.00M
6.00M
1.23%
80.48%
0.76%
$6.01M
WETH
1.40M
1.80M
35.14%
32.71%
83.57%
$189.87M
SNX
1.10M
4.50M
1.44%
56.82%
0.62%
$1.02M
1INCH
720.00K
30.00M
11.39%
59.10%
0.46%
$1.40M
UNI
500.00K
4.00M
8.27%
43.21%
2.39%
$9.05M
FXS
500.00K
1.20M
0.39%
56.79%
0.29%
$8.84M
RPL
480.00K
840.00K
31.22%
53.31%
33.47%
$1.08M
BAL
370.00K
1.40M
31.81%
53.20%
15.80%
$15.48M
ENS
40.00K
1.50M
10.58%
47.18%
0.60%
$1.67M
WBTC
28.00K
43.00K
6.52%
49.56%
8.57%
$149.30M
wstETH
24.00K
1.10M
19.85%
80.45%
0.54%
$169.10M
rETH
19.20K
90.00K
2.32%
50.49%
0.98%
$109.09M
MKR
3.00K
22.50K
19.17%
61.79%
4.14%
$21.06M
cbETH
2.40K
60.00K
16.93%
15.36%
4.41%
$7.23M
Top Movers
STG’s borrow balance increased WoW by 74% from $10K to $18K.
wstETH’s supply balance increased WoW by 27% from $2B to $3B.
STG’s utilization increased WoW by 52% from 1% to 2%.
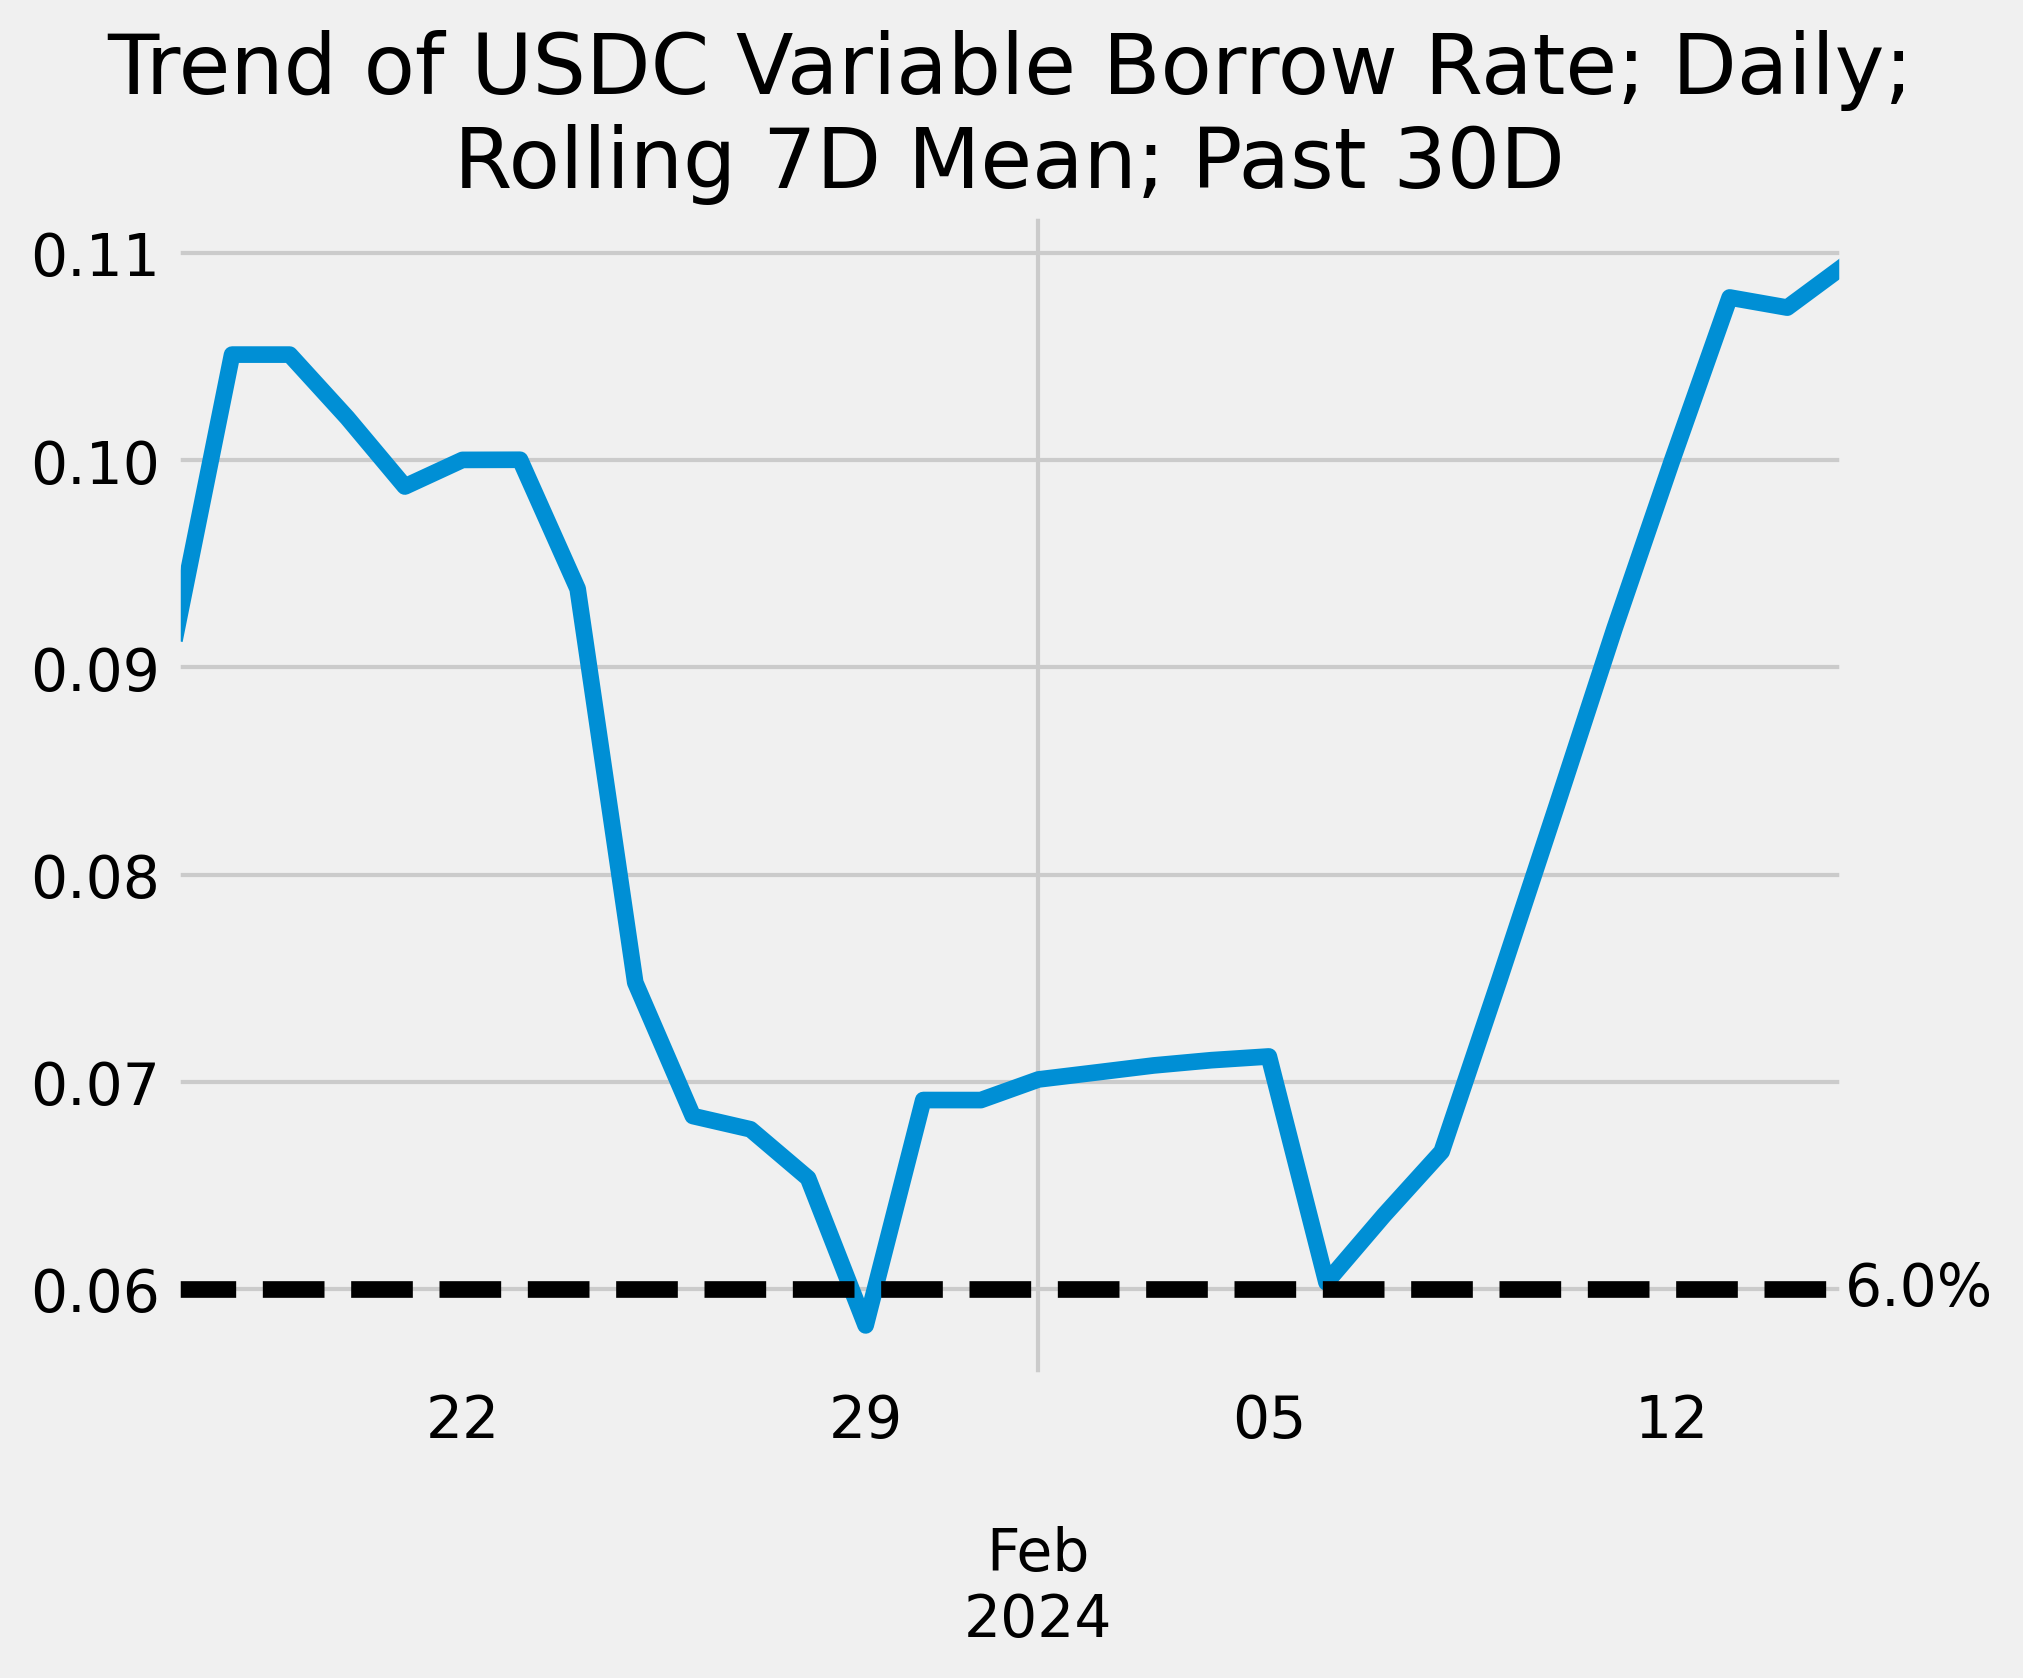
Key Interest Rates
Real borrow rates rocketed this week. At the same time, we observe curbed circulation and that TradFi real yield rises to 2% for first time since December Fed pivot.
Below shows circulating supply of USD-pegged public stablecoins
Weekly Annualized Reserve and Interest Projections
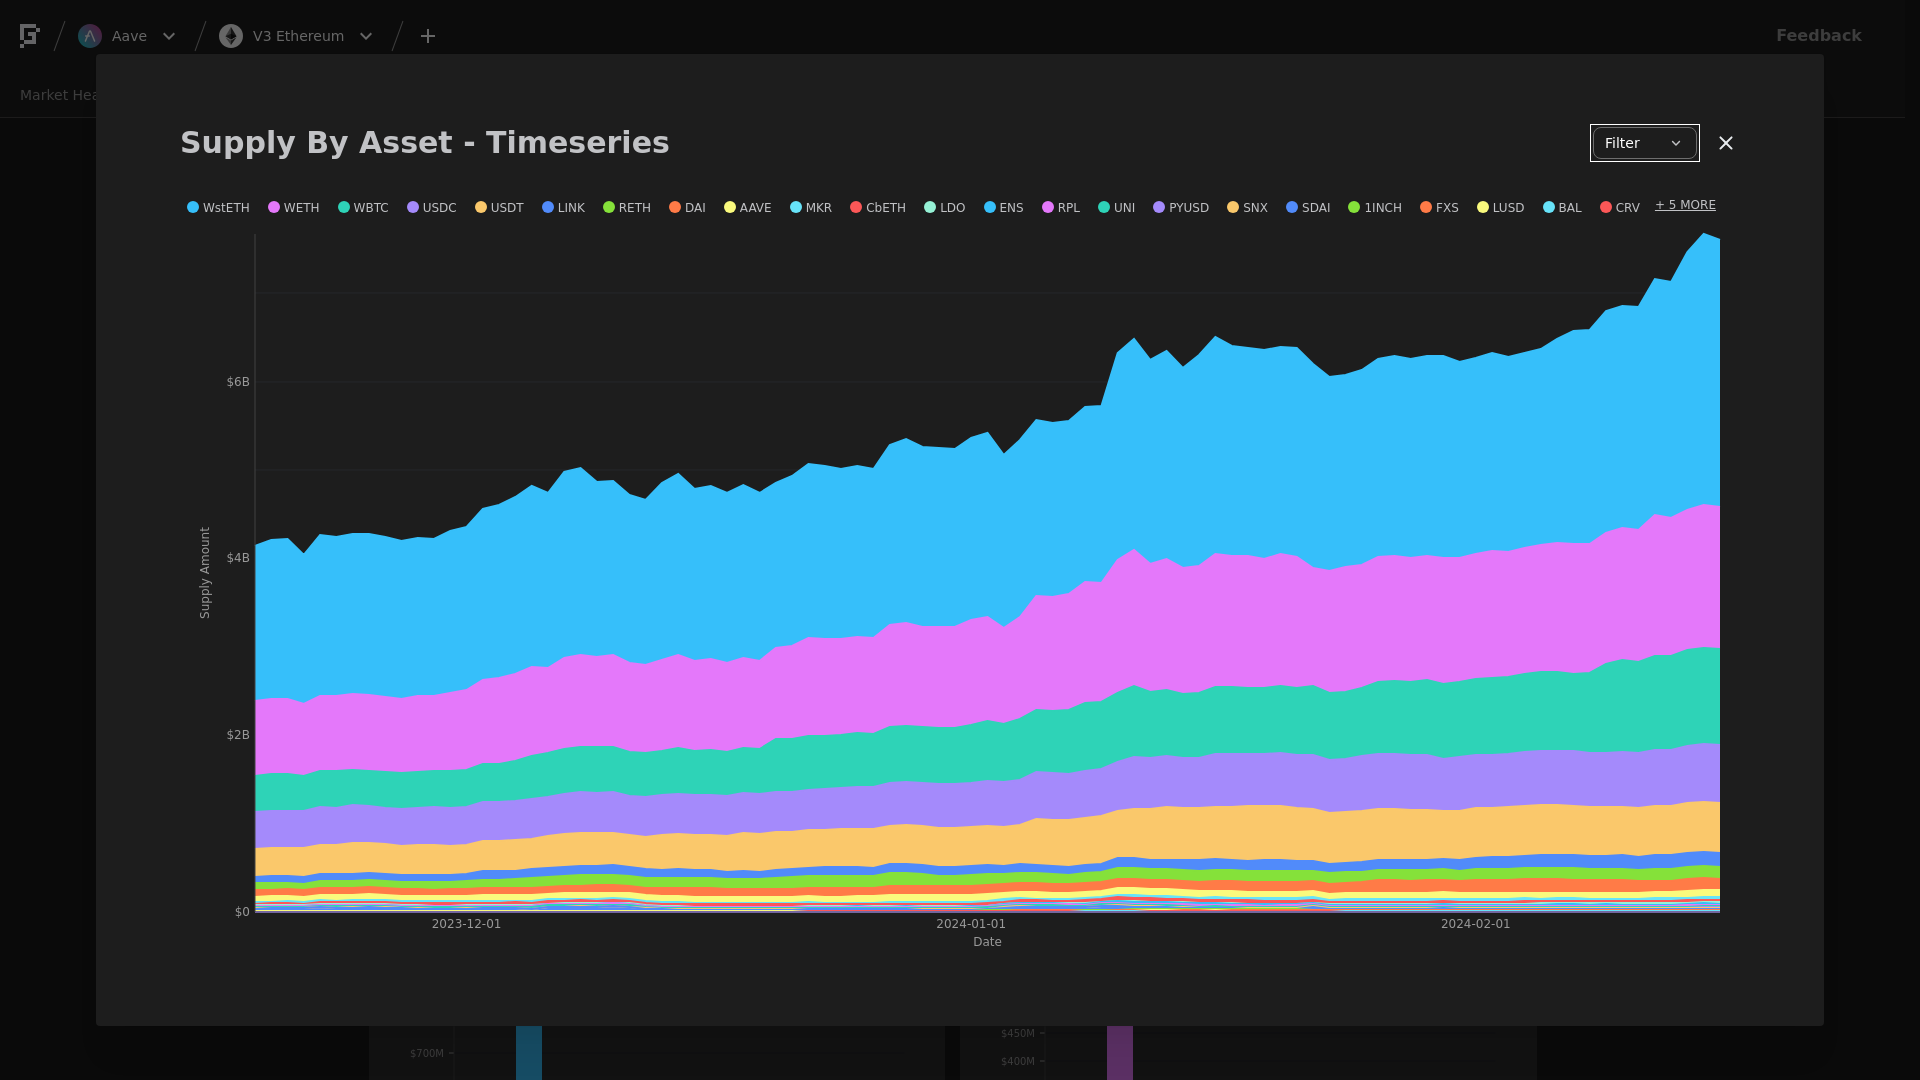
Supply Trend
This graph shows the total supply of all assets over the time frame in question. To see updated statistics, please see the live version of this graph here.
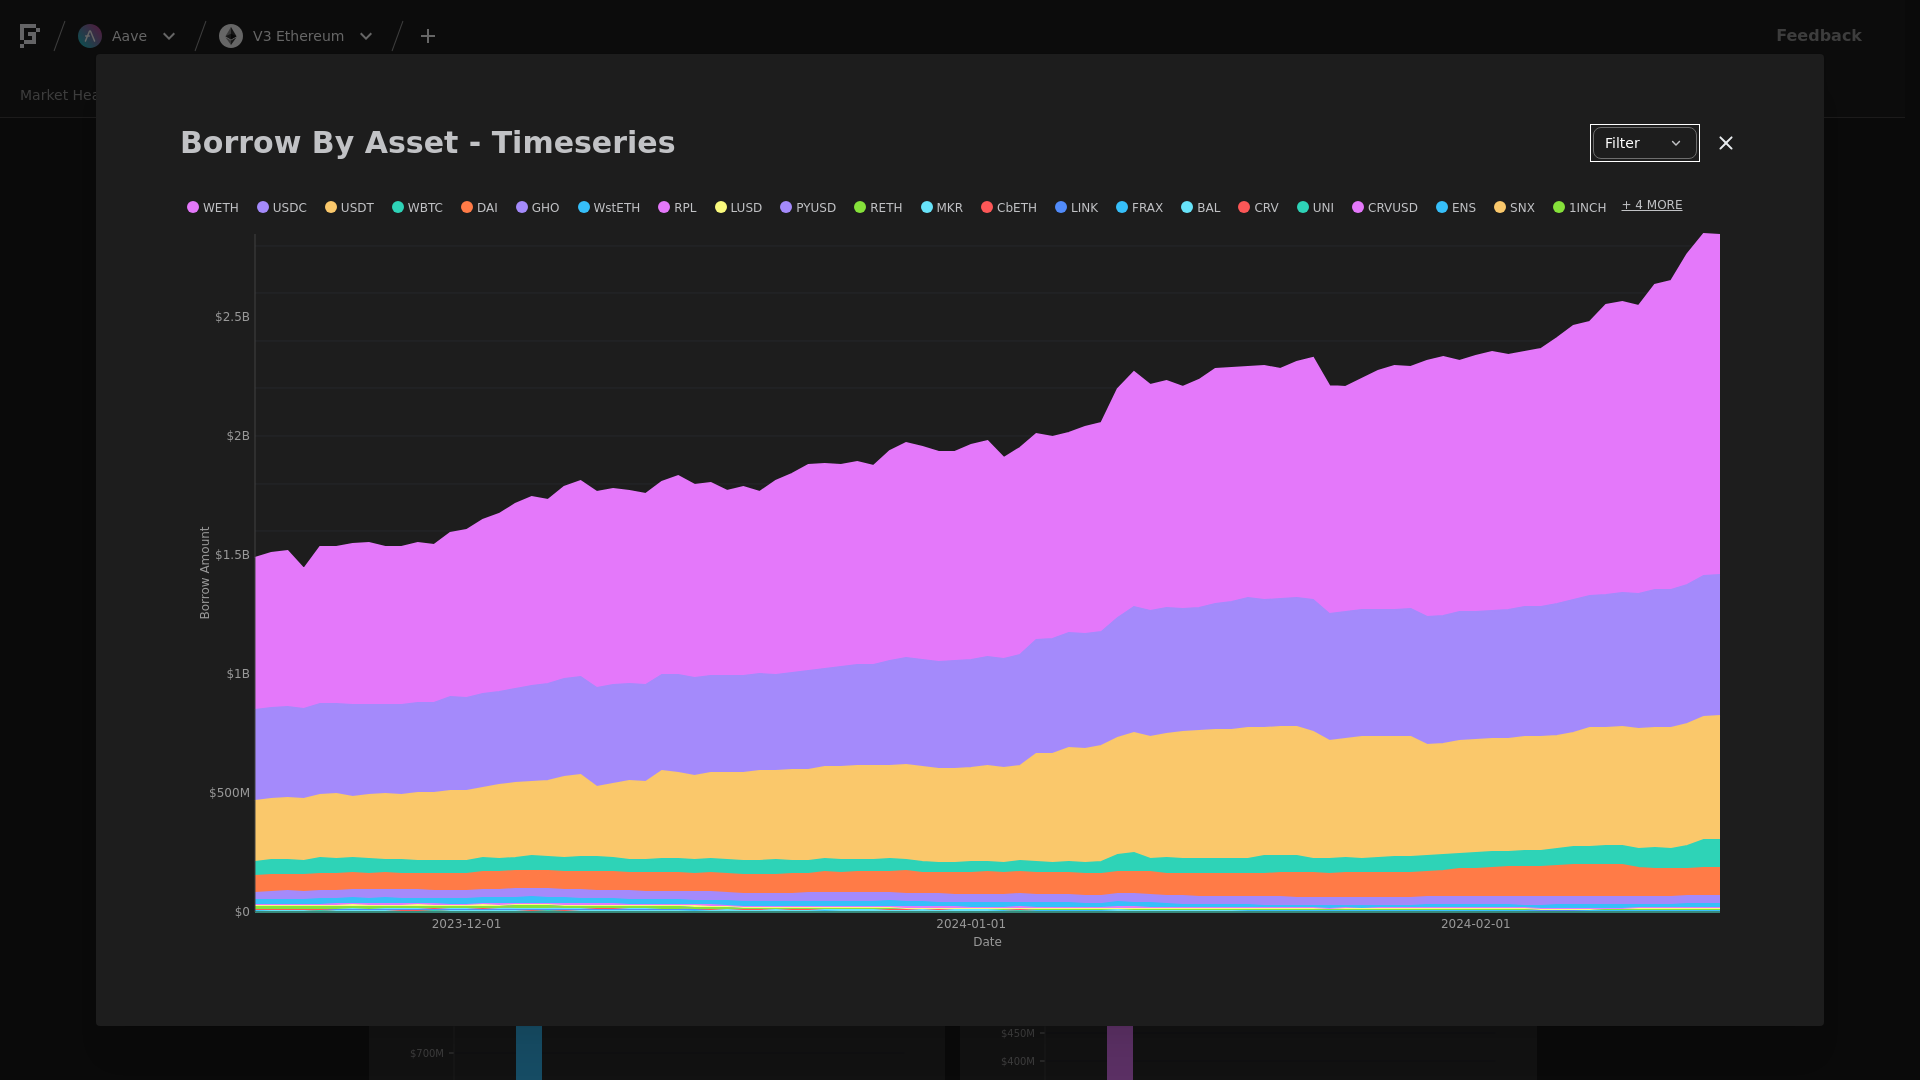
Borrows Trend
This graph shows the total borrows of all assets over the time frame in question. To see updated statistics, please see the live version of this graph here.
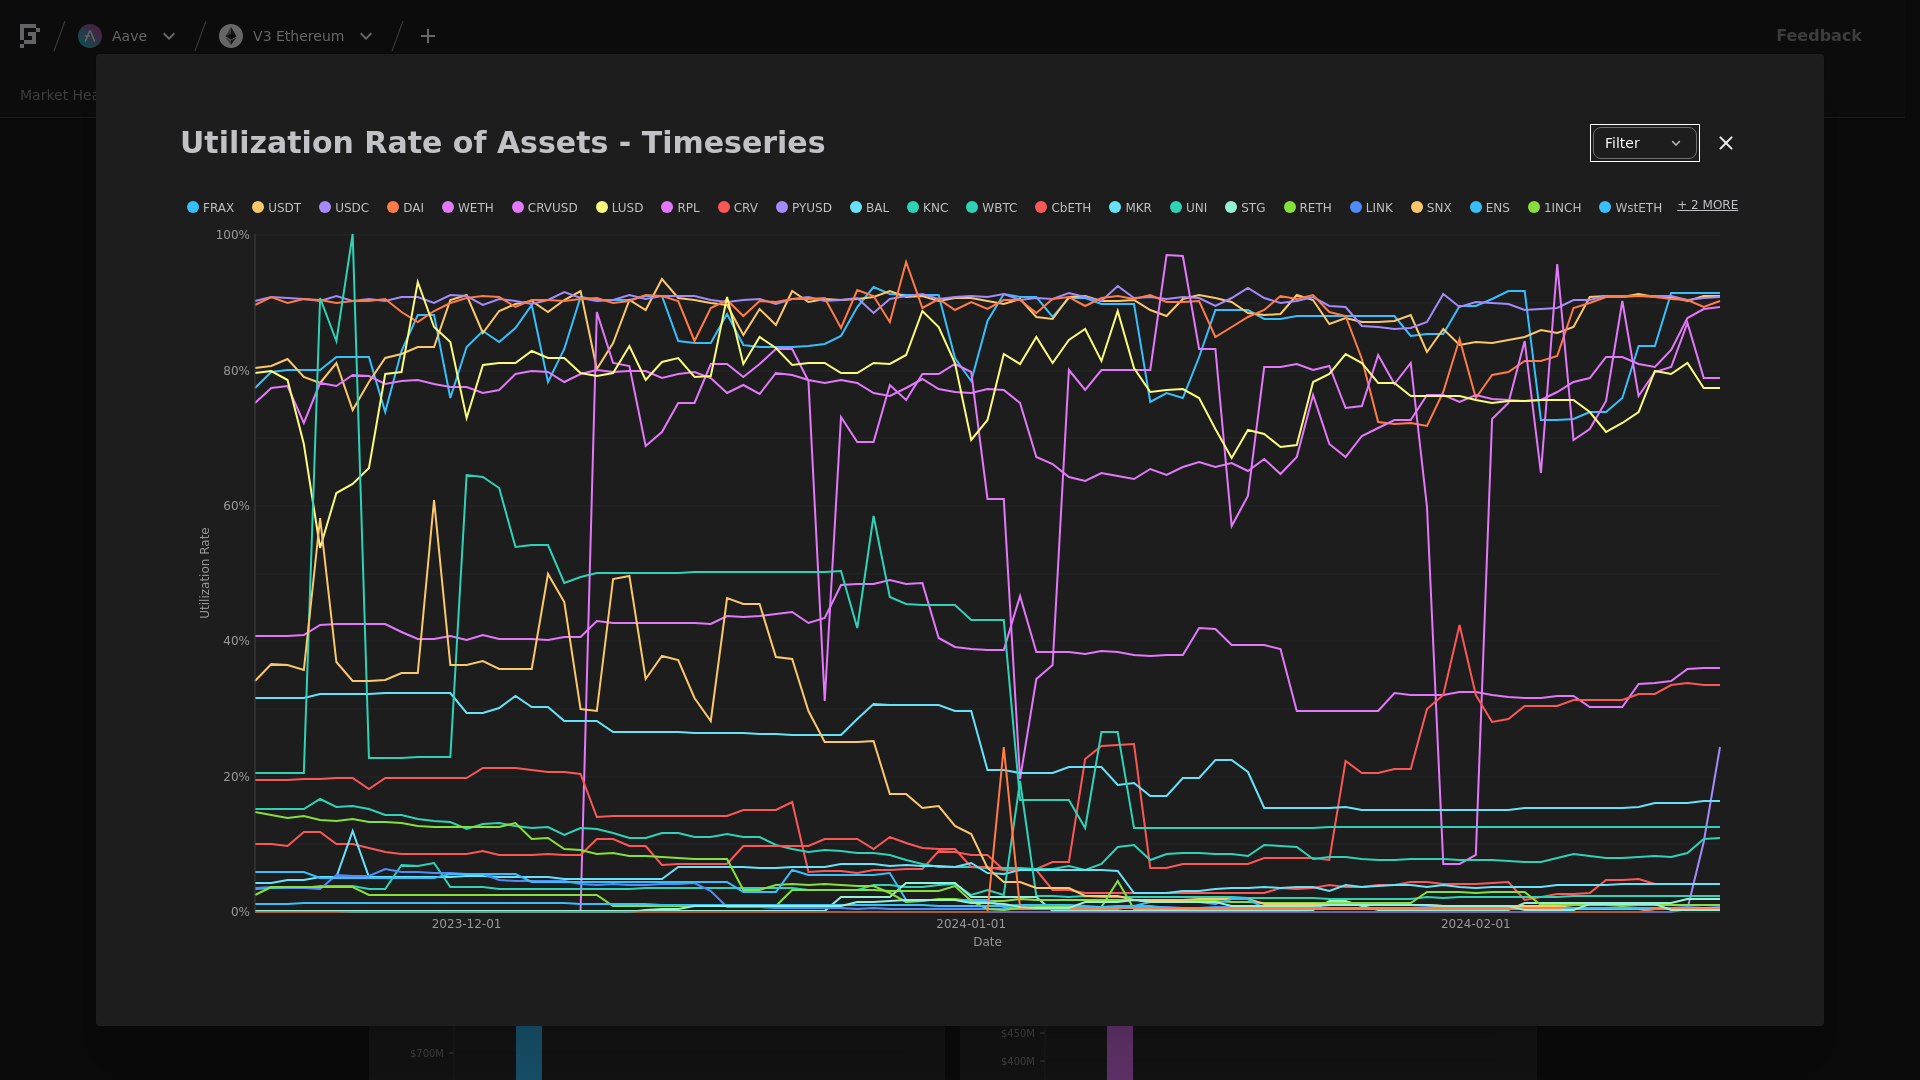
Utilization Trend
This graph shows the utilization (borrow / supply) of all assets over the time frame in question.
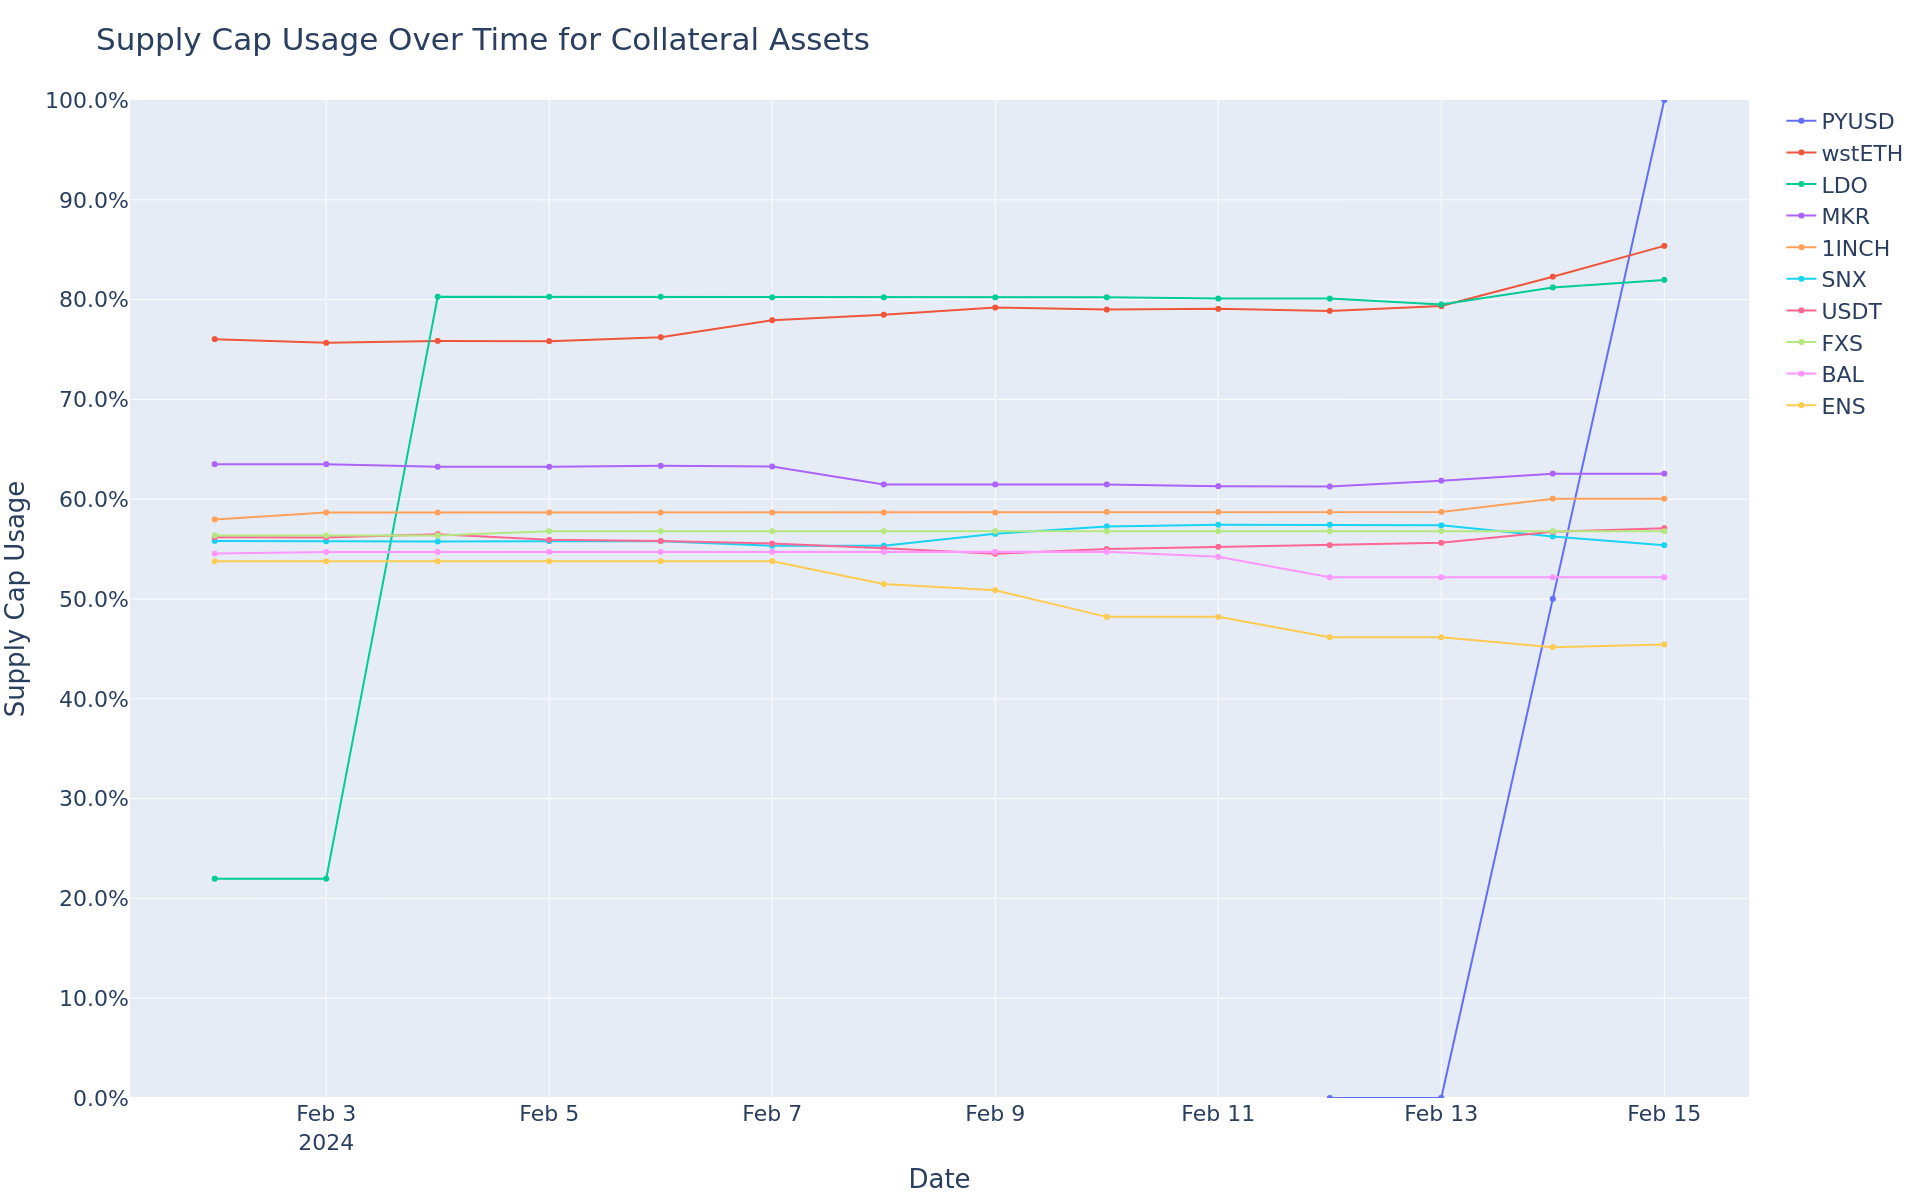
Supply Cap Usage Trend
This graph shows the supply cap usage (supply / supply cap) of all assets over the time frame in question.
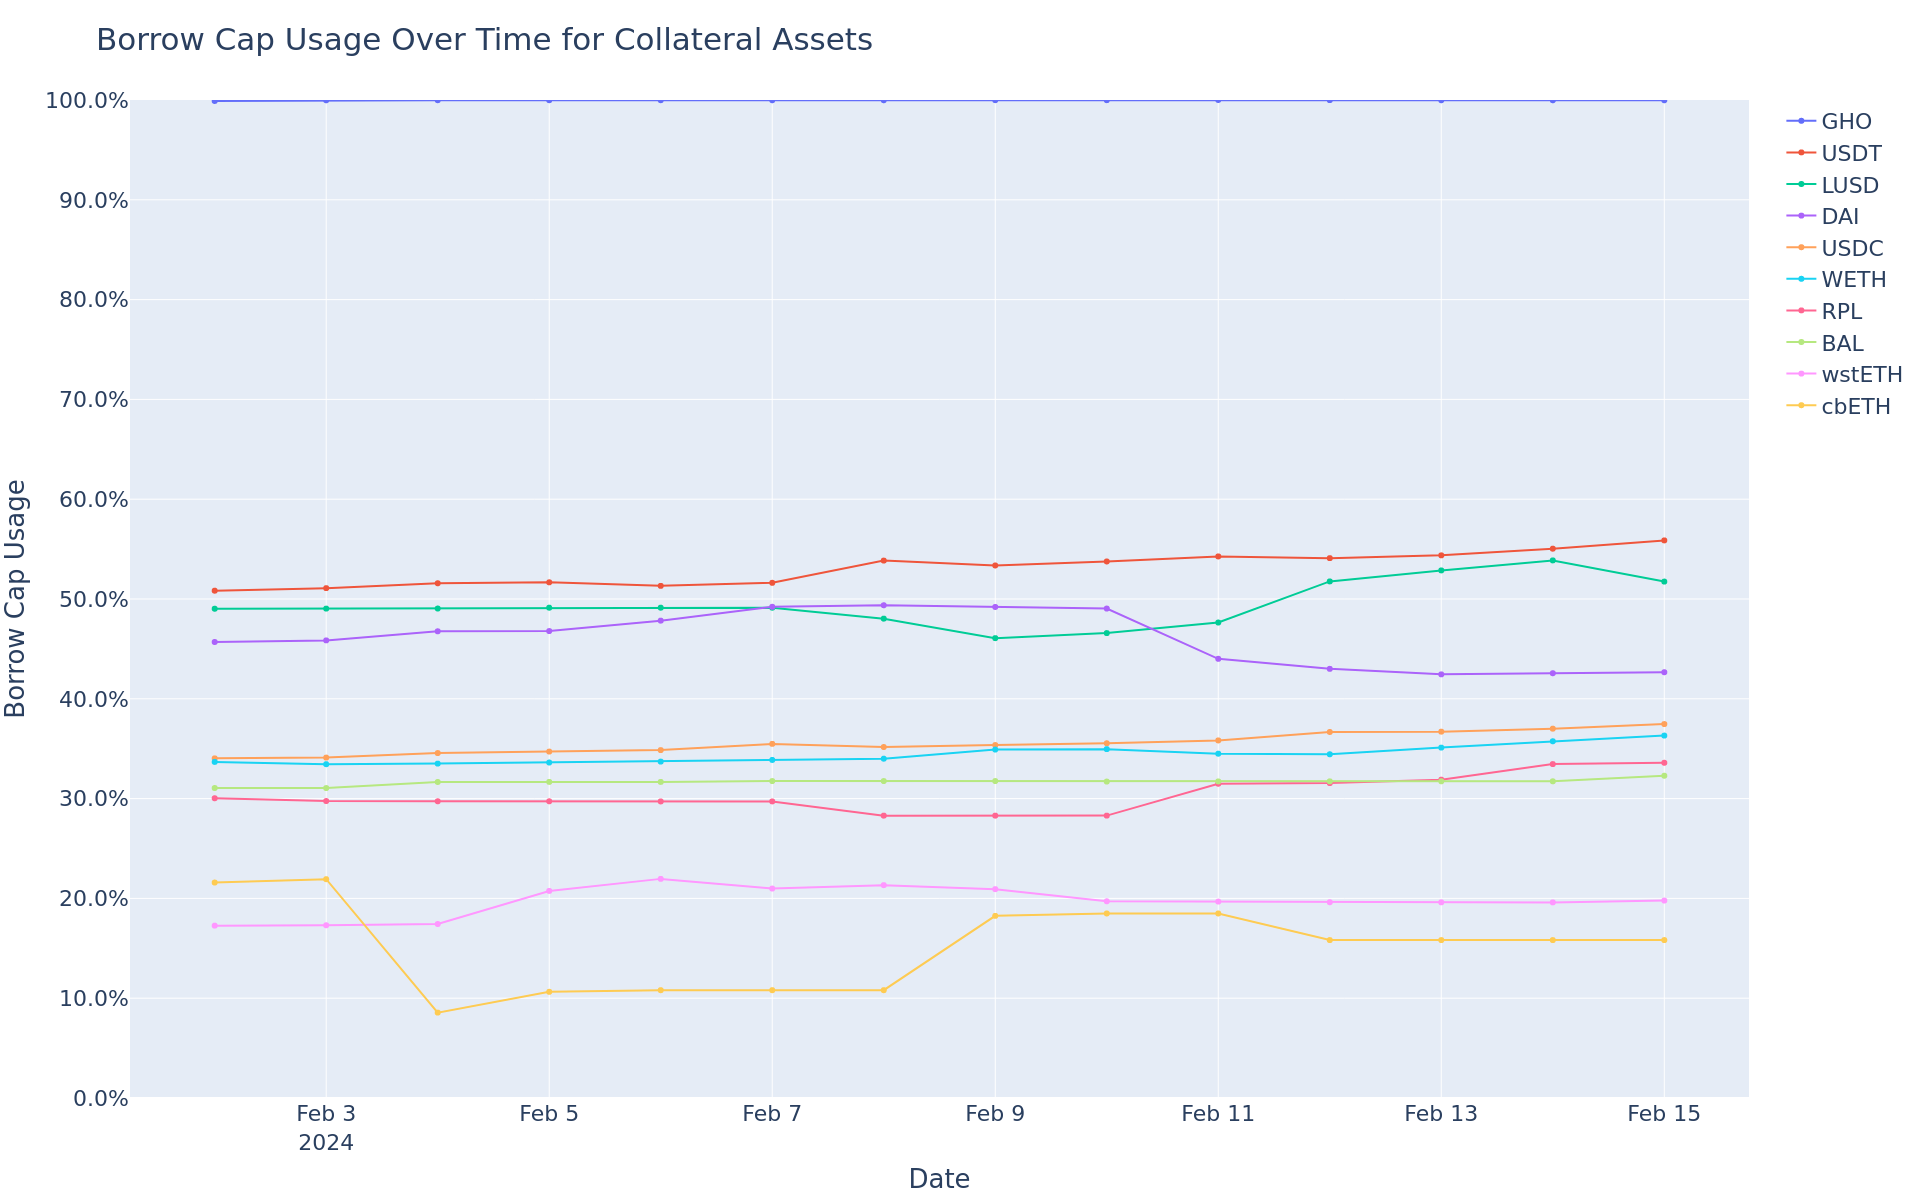
Borrow Cap Usage Trend
This graph shows the borrow cap usage (borrow / borrow cap) of all assets over the time frame in question.