[Gauntlet] V3 Optimism Market Weekly: (2024-01-26 through 2024-02-01)
Gauntlet would like to provide the community with an update on this market over the previous week. Gauntlet is continuing to monitor this market. At this time, we do not recommend any parameter updates, but will keep the community informed.
Summary
This table gives high-level statistics over the time frame in question. Bold lines correspond to weekly average supply cap usage over 75%.
USDC’s borrow balance increased WoW by 18% from $4M to $5M.
MAI’s borrow balance decreased WoW by -78% from $79K to $18K.
rETH’s supply balance increased WoW by 38% from $2M to $2M.
MAI’s supply balance decreased WoW by -74% from $180K to $46K.
LUSD’s utilization increased WoW by 8% from 77% to 83%.
rETH’s utilization decreased WoW by -20% from 3% to 2%.
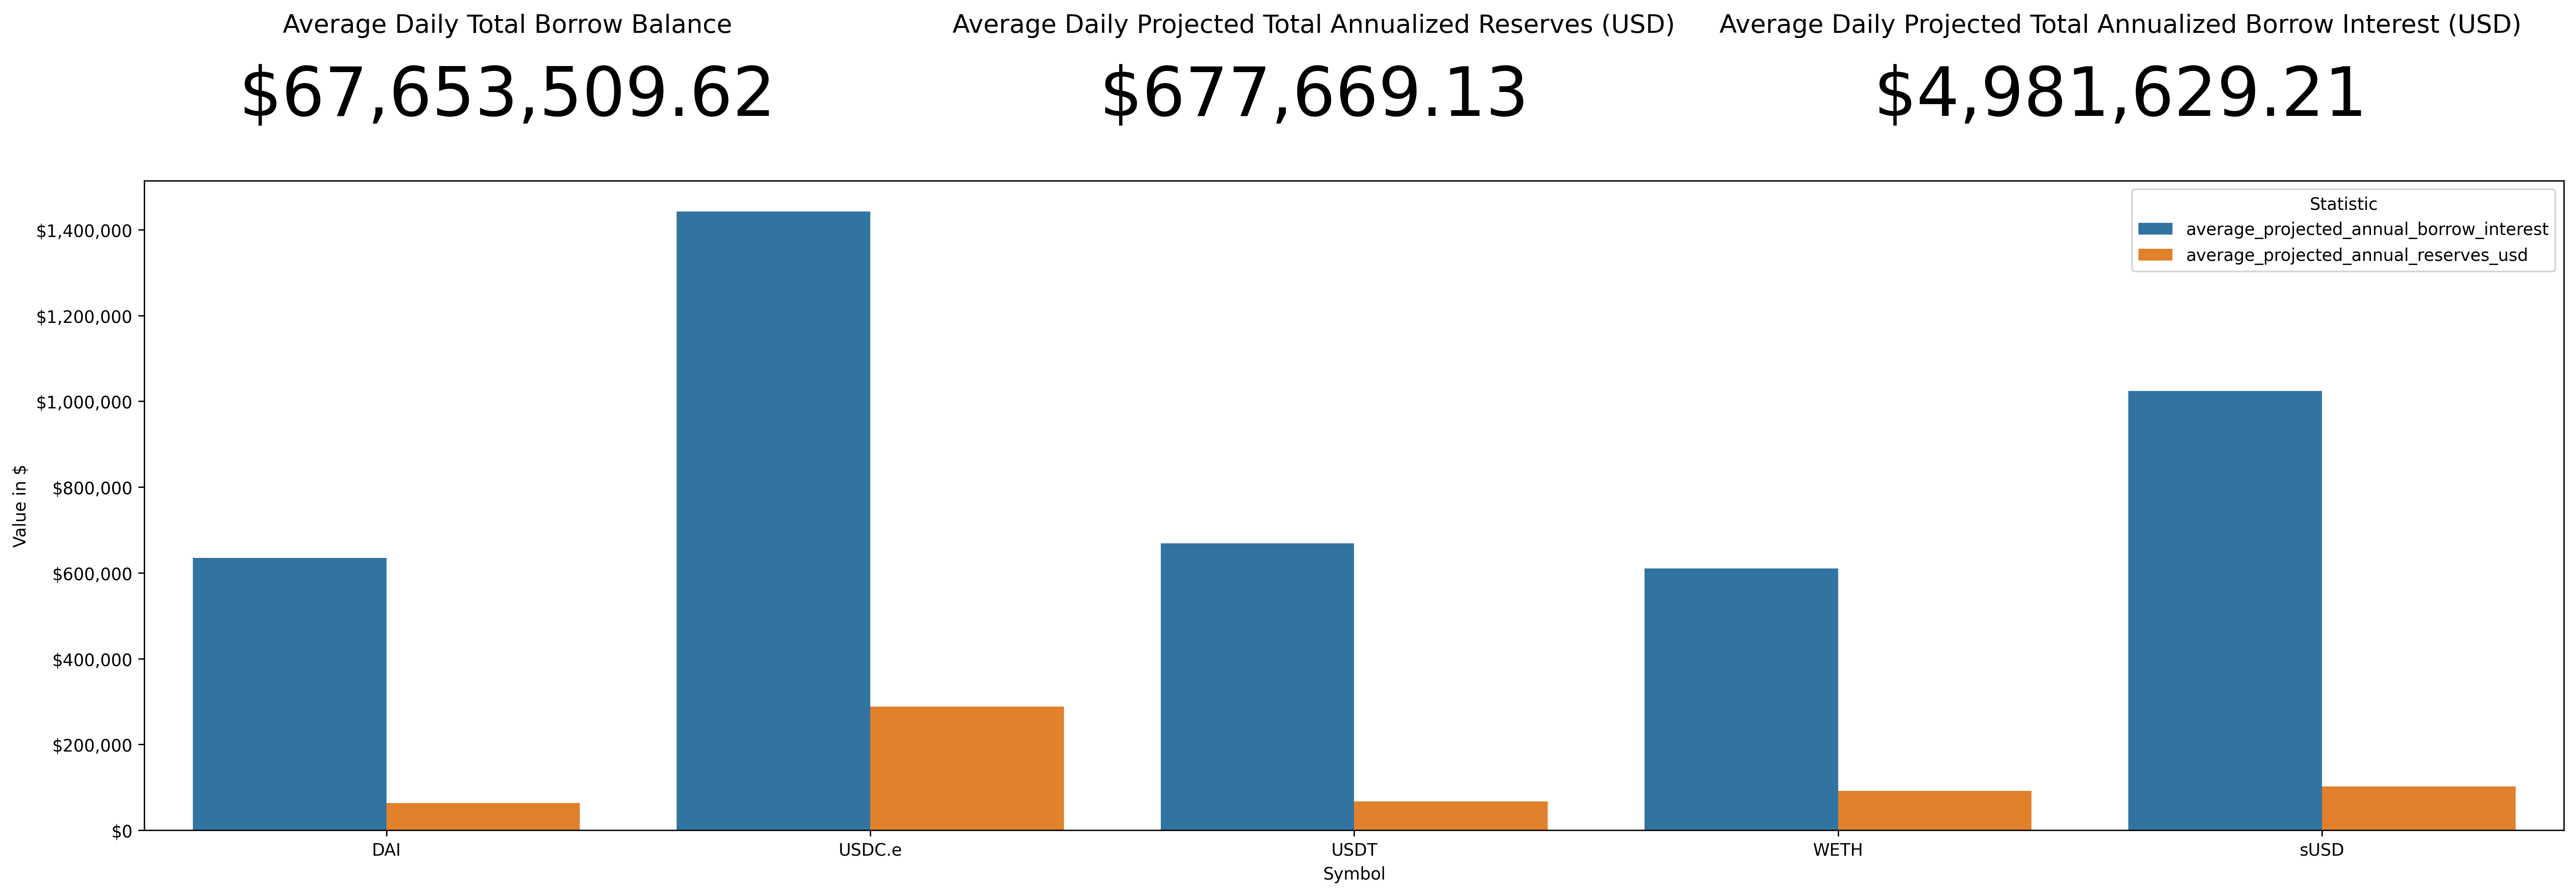
Weekly Annualized Reserve and Interest Projections
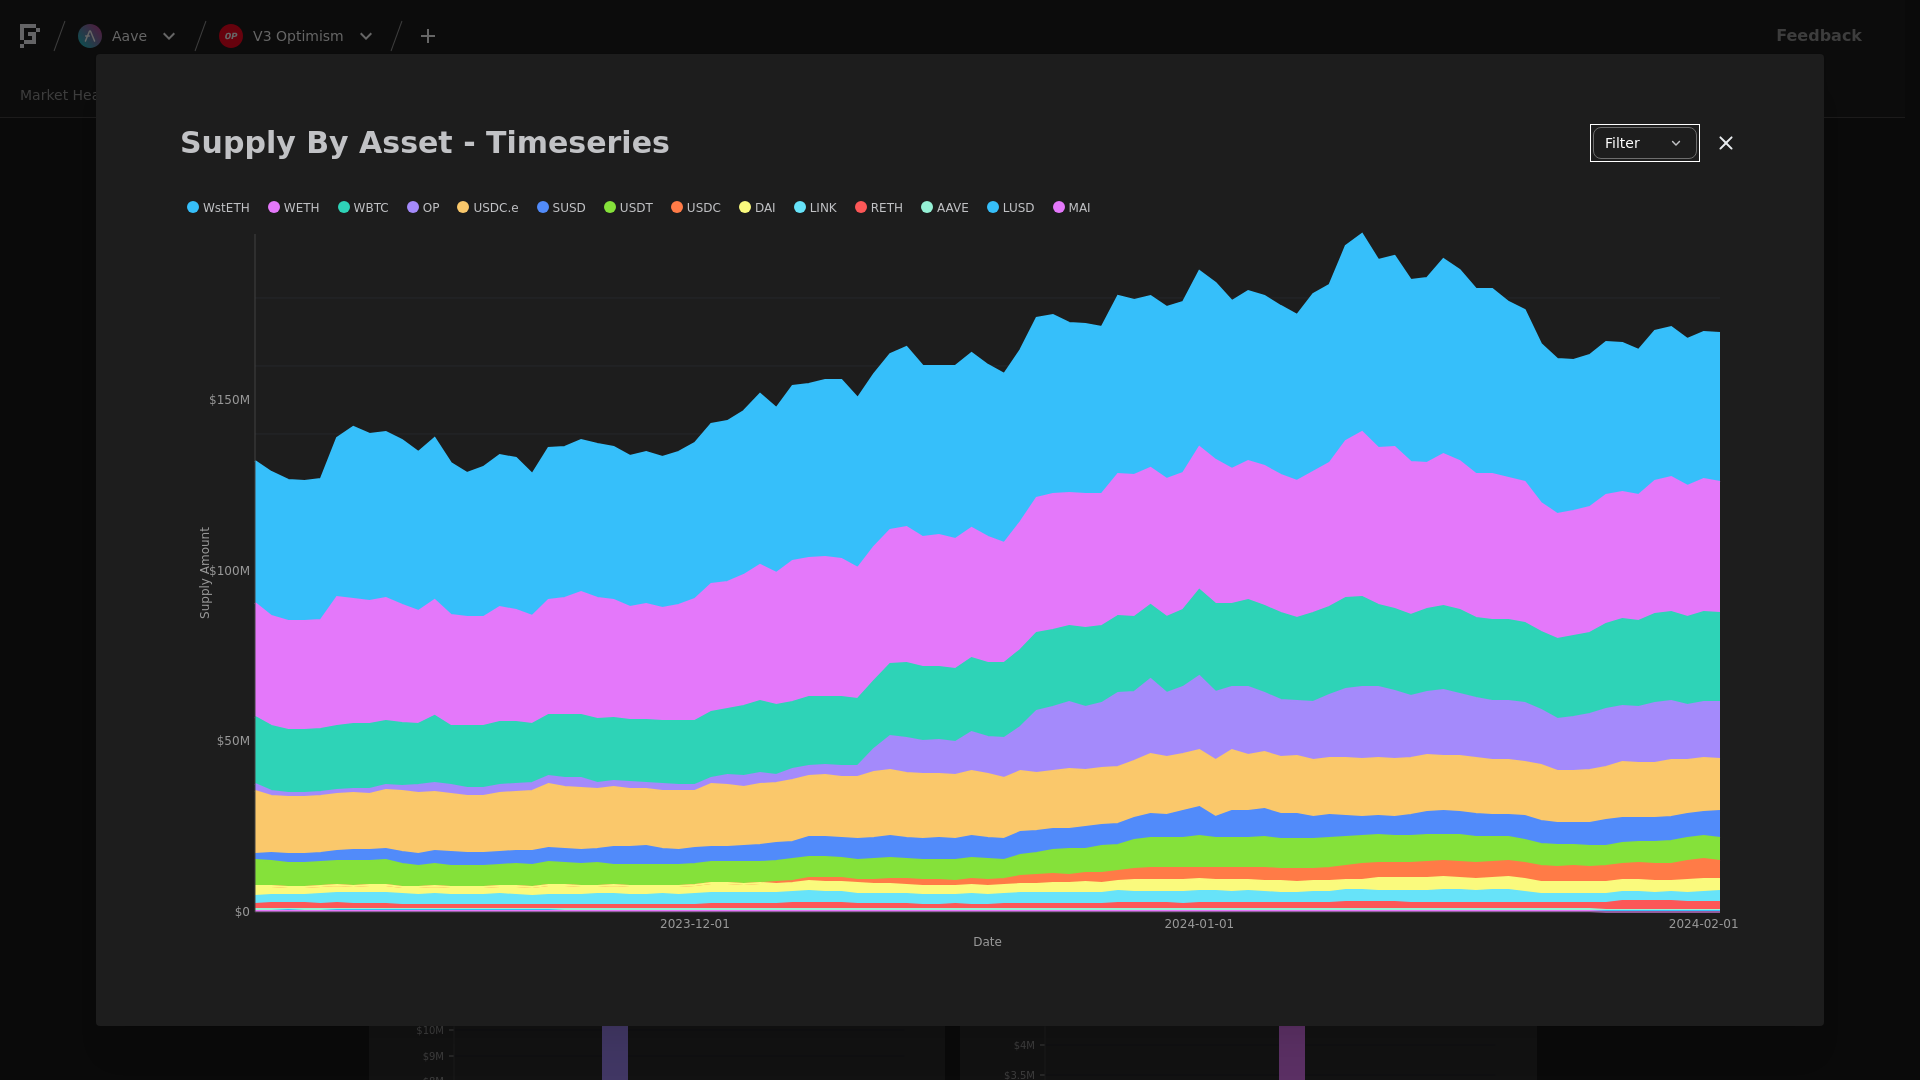
Supply Trend
This graph shows the total supply of all assets over the time frame in question. To see updated statistics, please see the live version of this graph here.
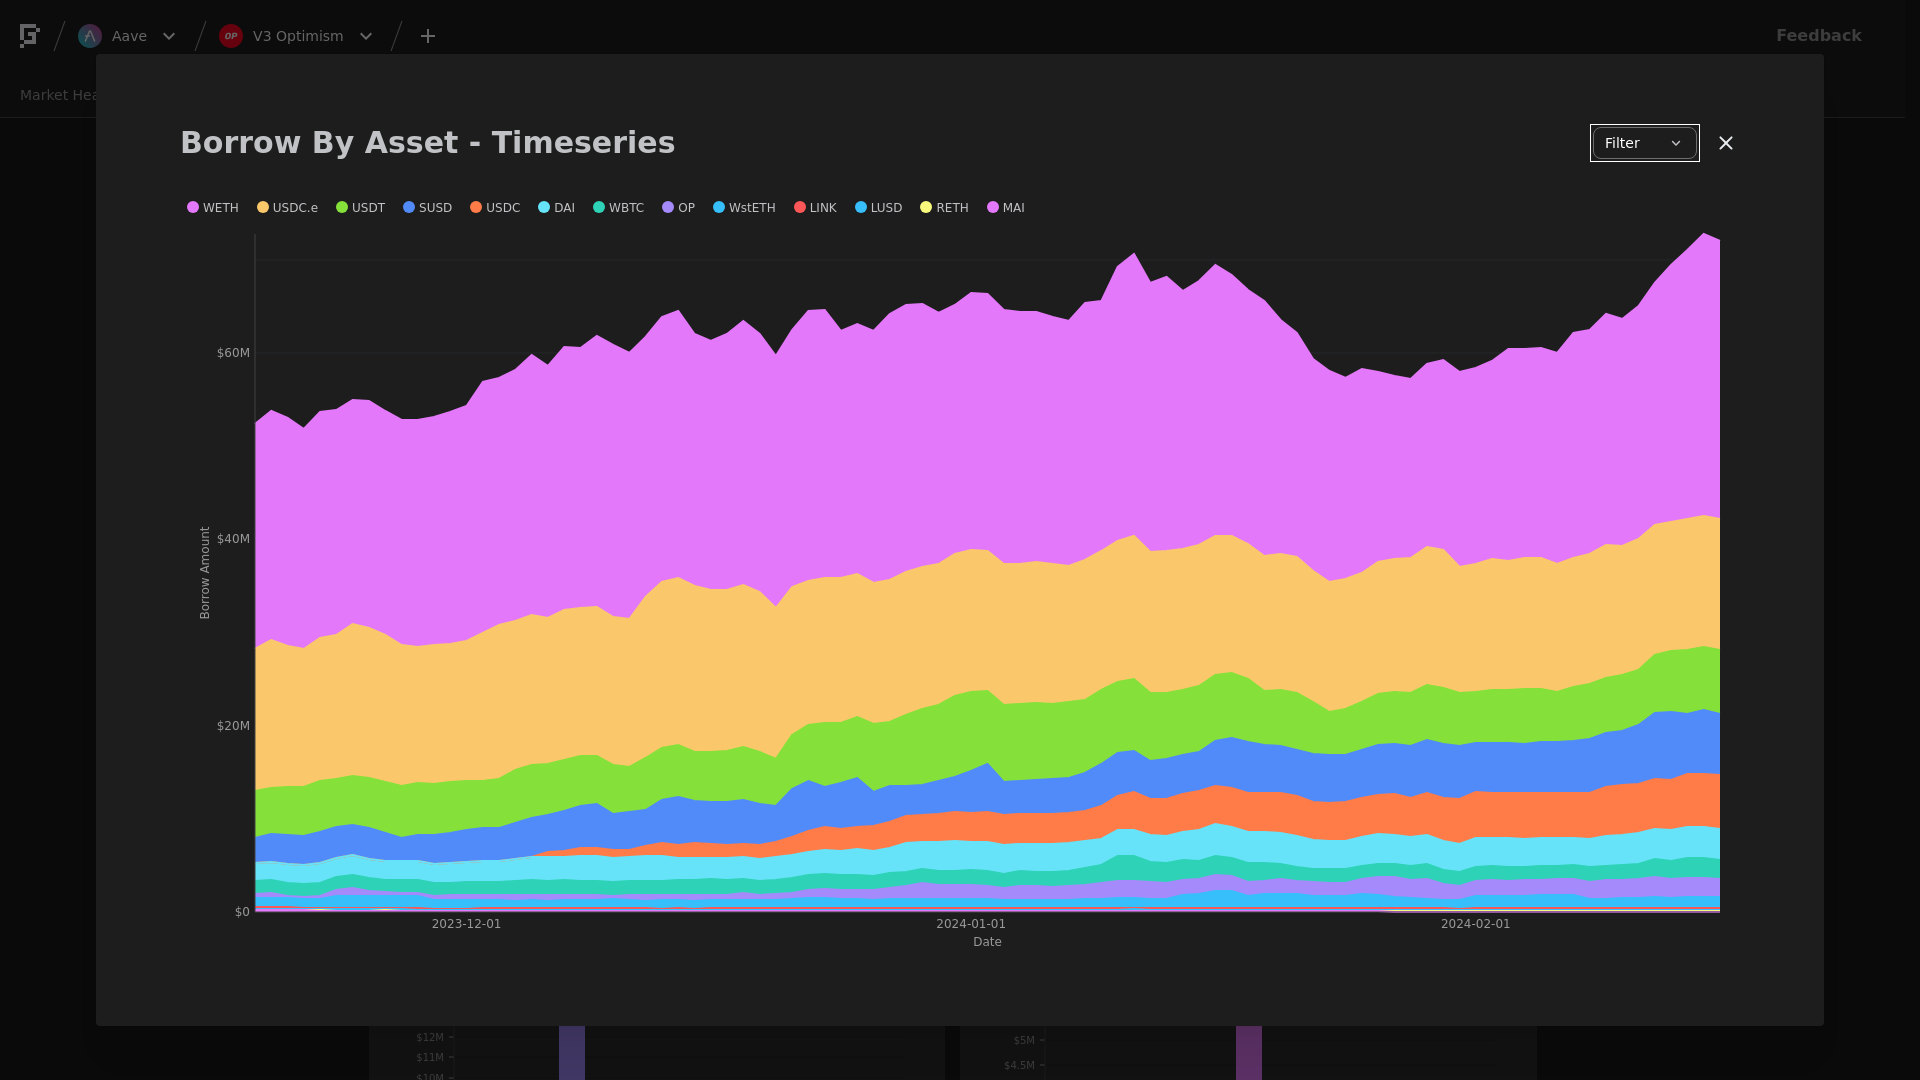
Borrows Trend
This graph shows the total borrows of all assets over the time frame in question. To see updated statistics, please see the live version of this graph here.
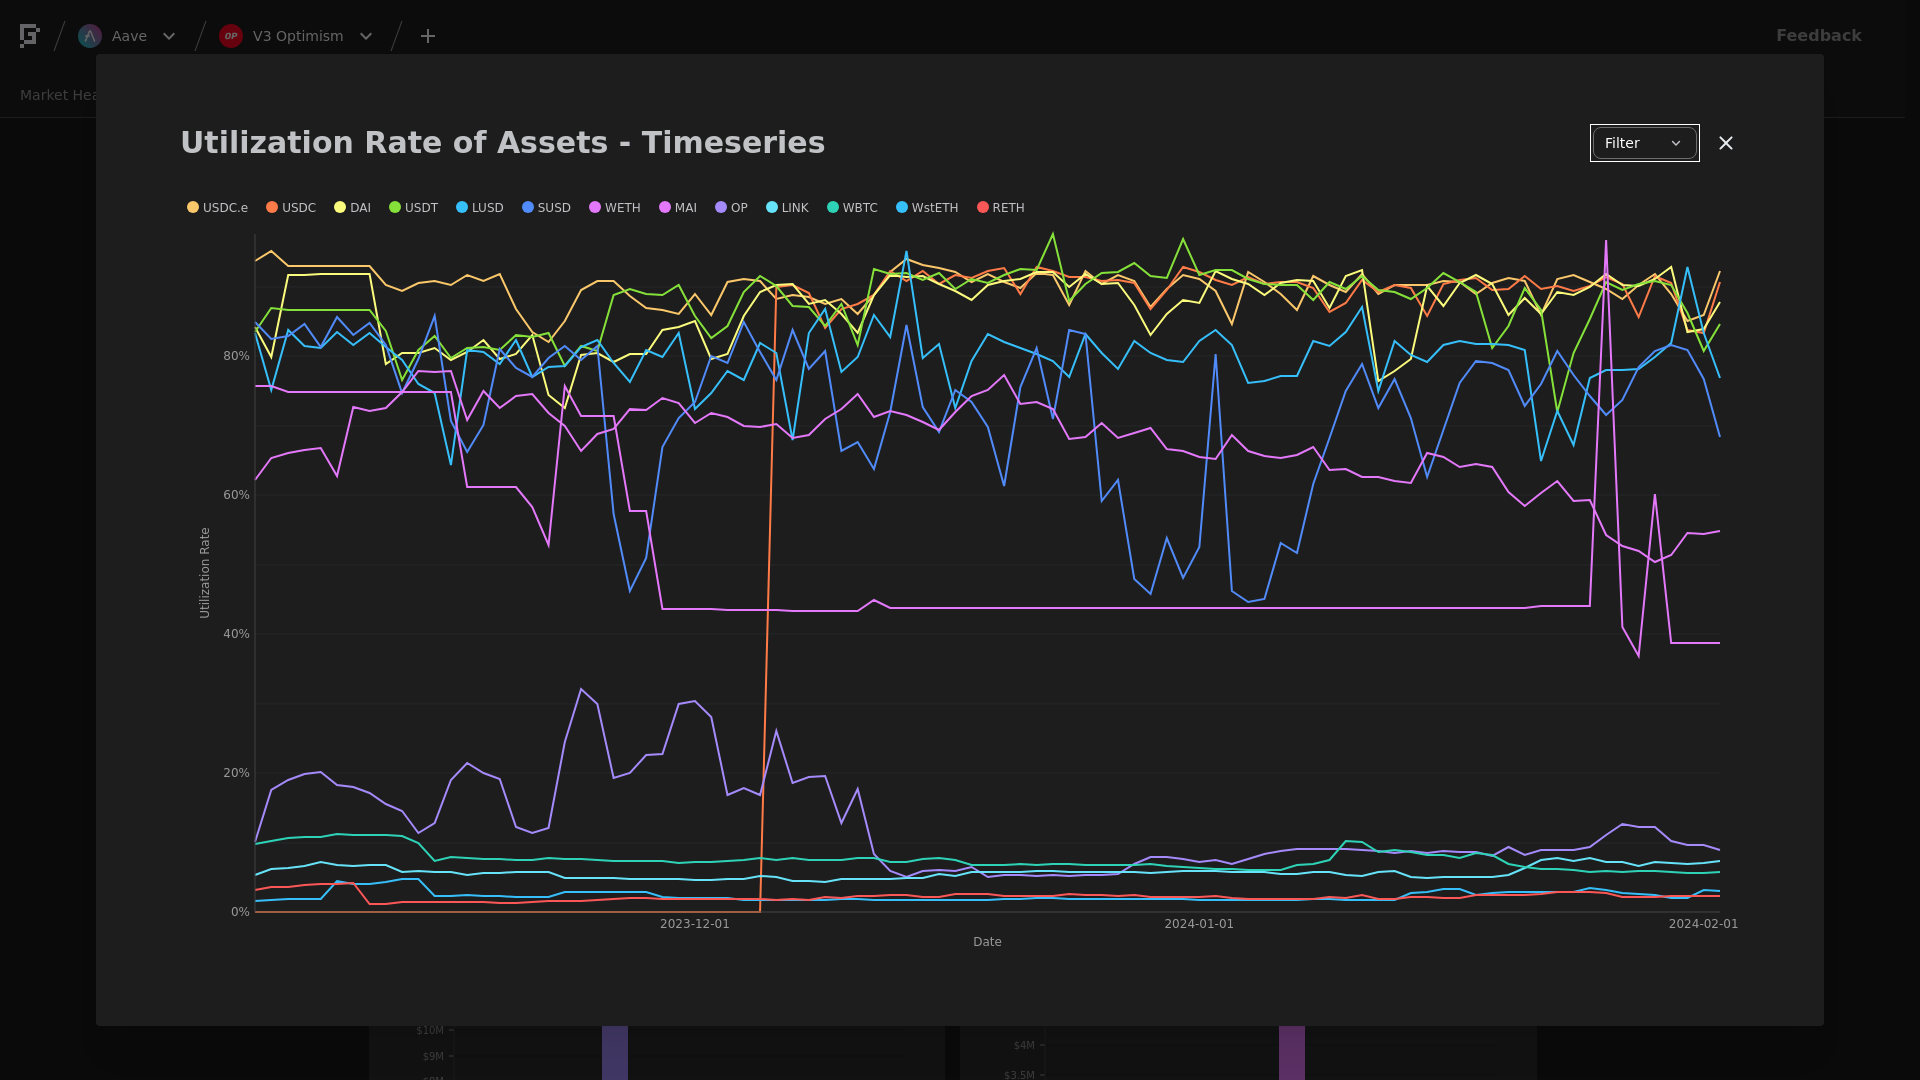
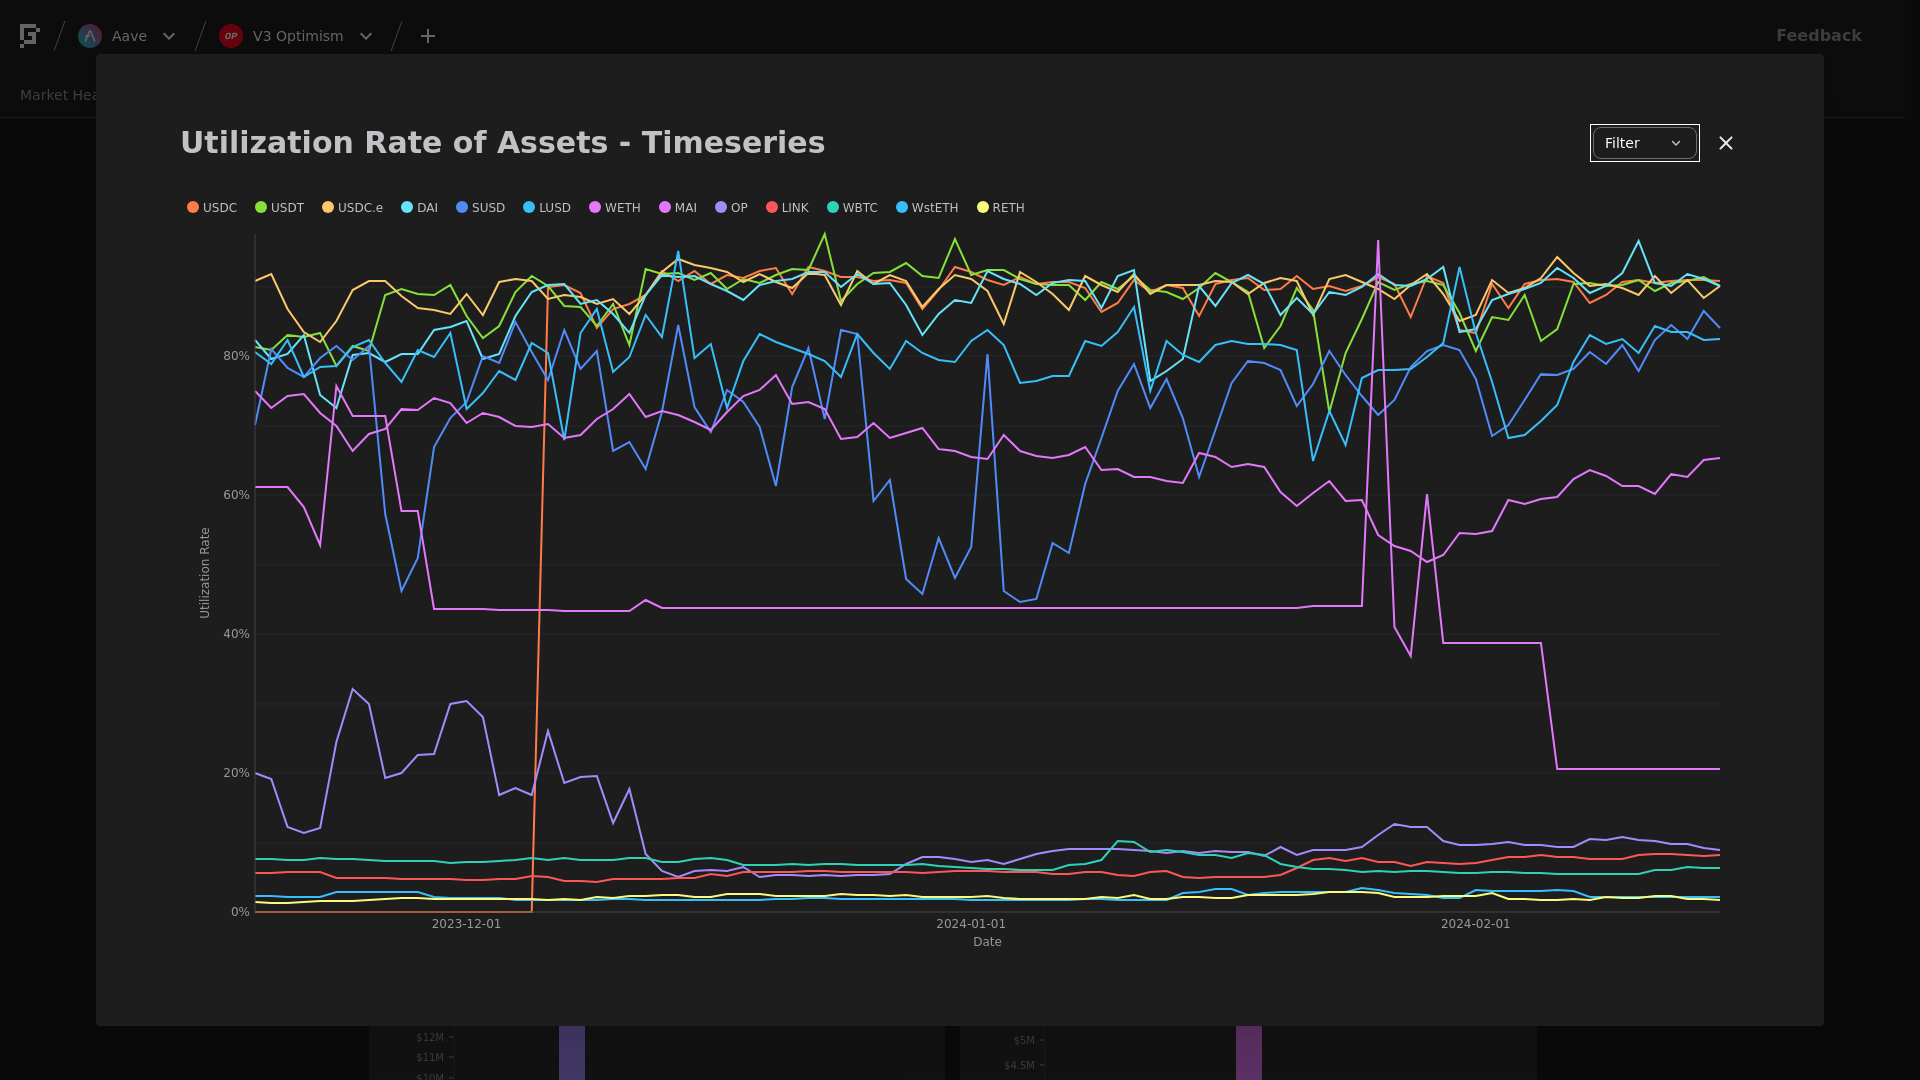
Utilization Trend
This graph shows the utilization (borrow / supply) of all assets over the time frame in question.
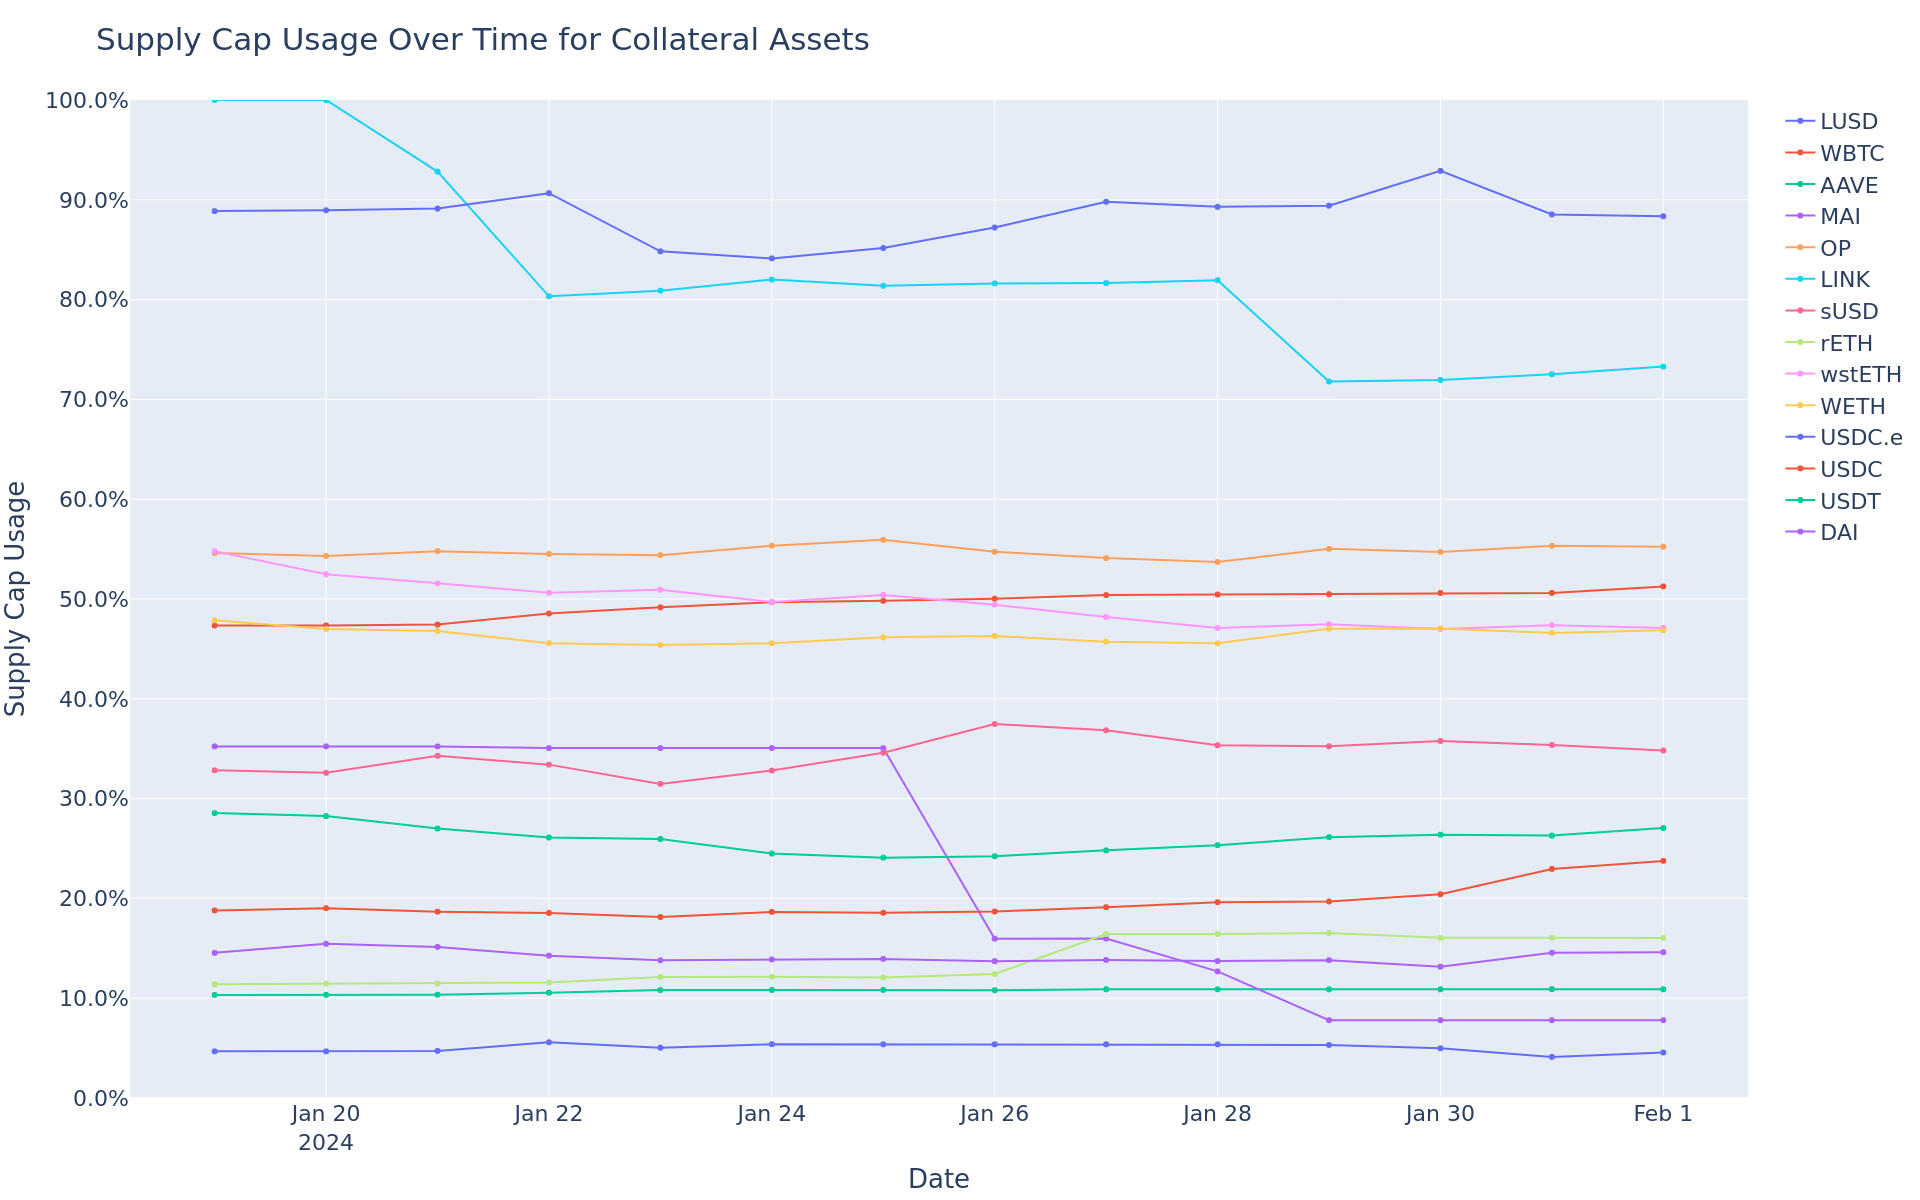
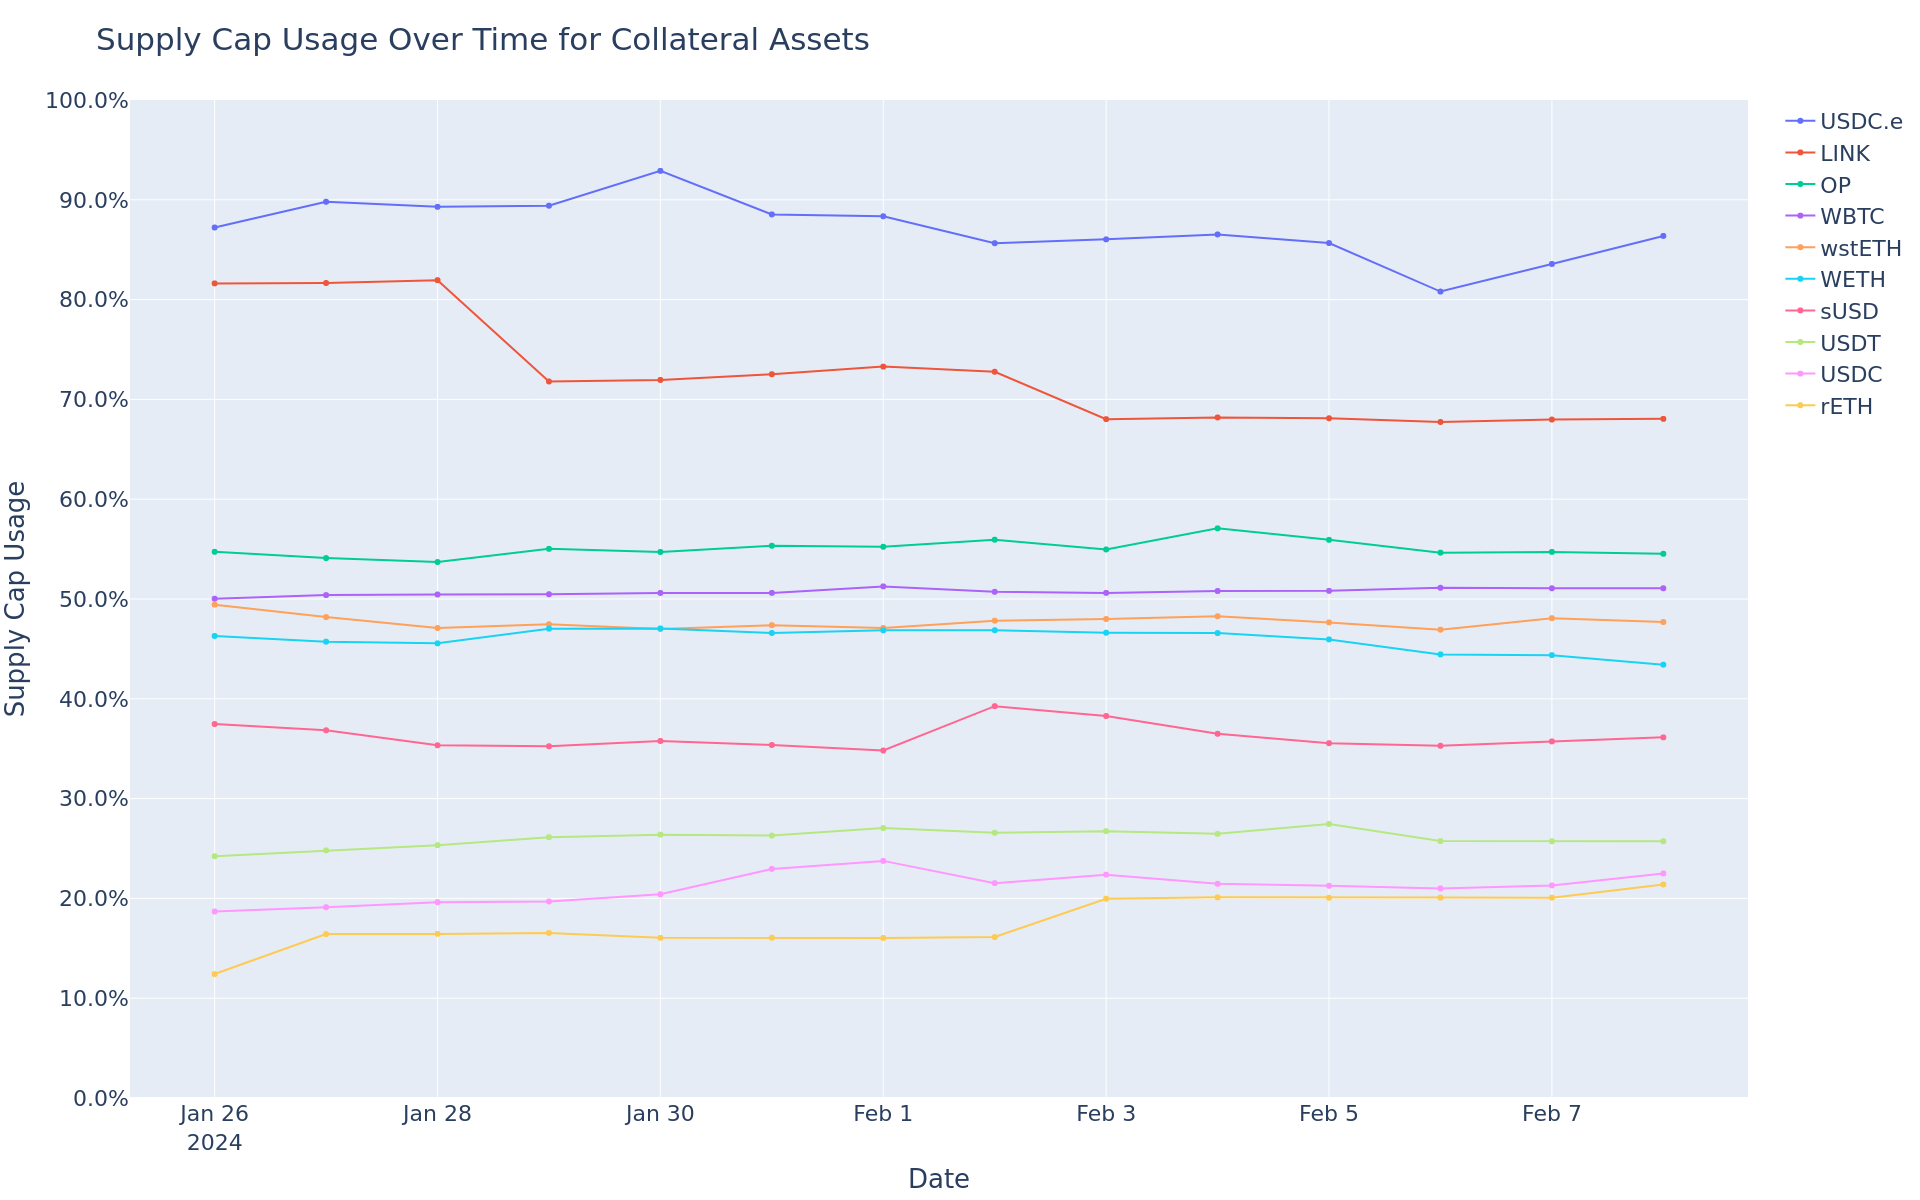
Supply Cap Usage Trend
This graph shows the supply cap usage (supply / supply cap) of all assets over the time frame in question.
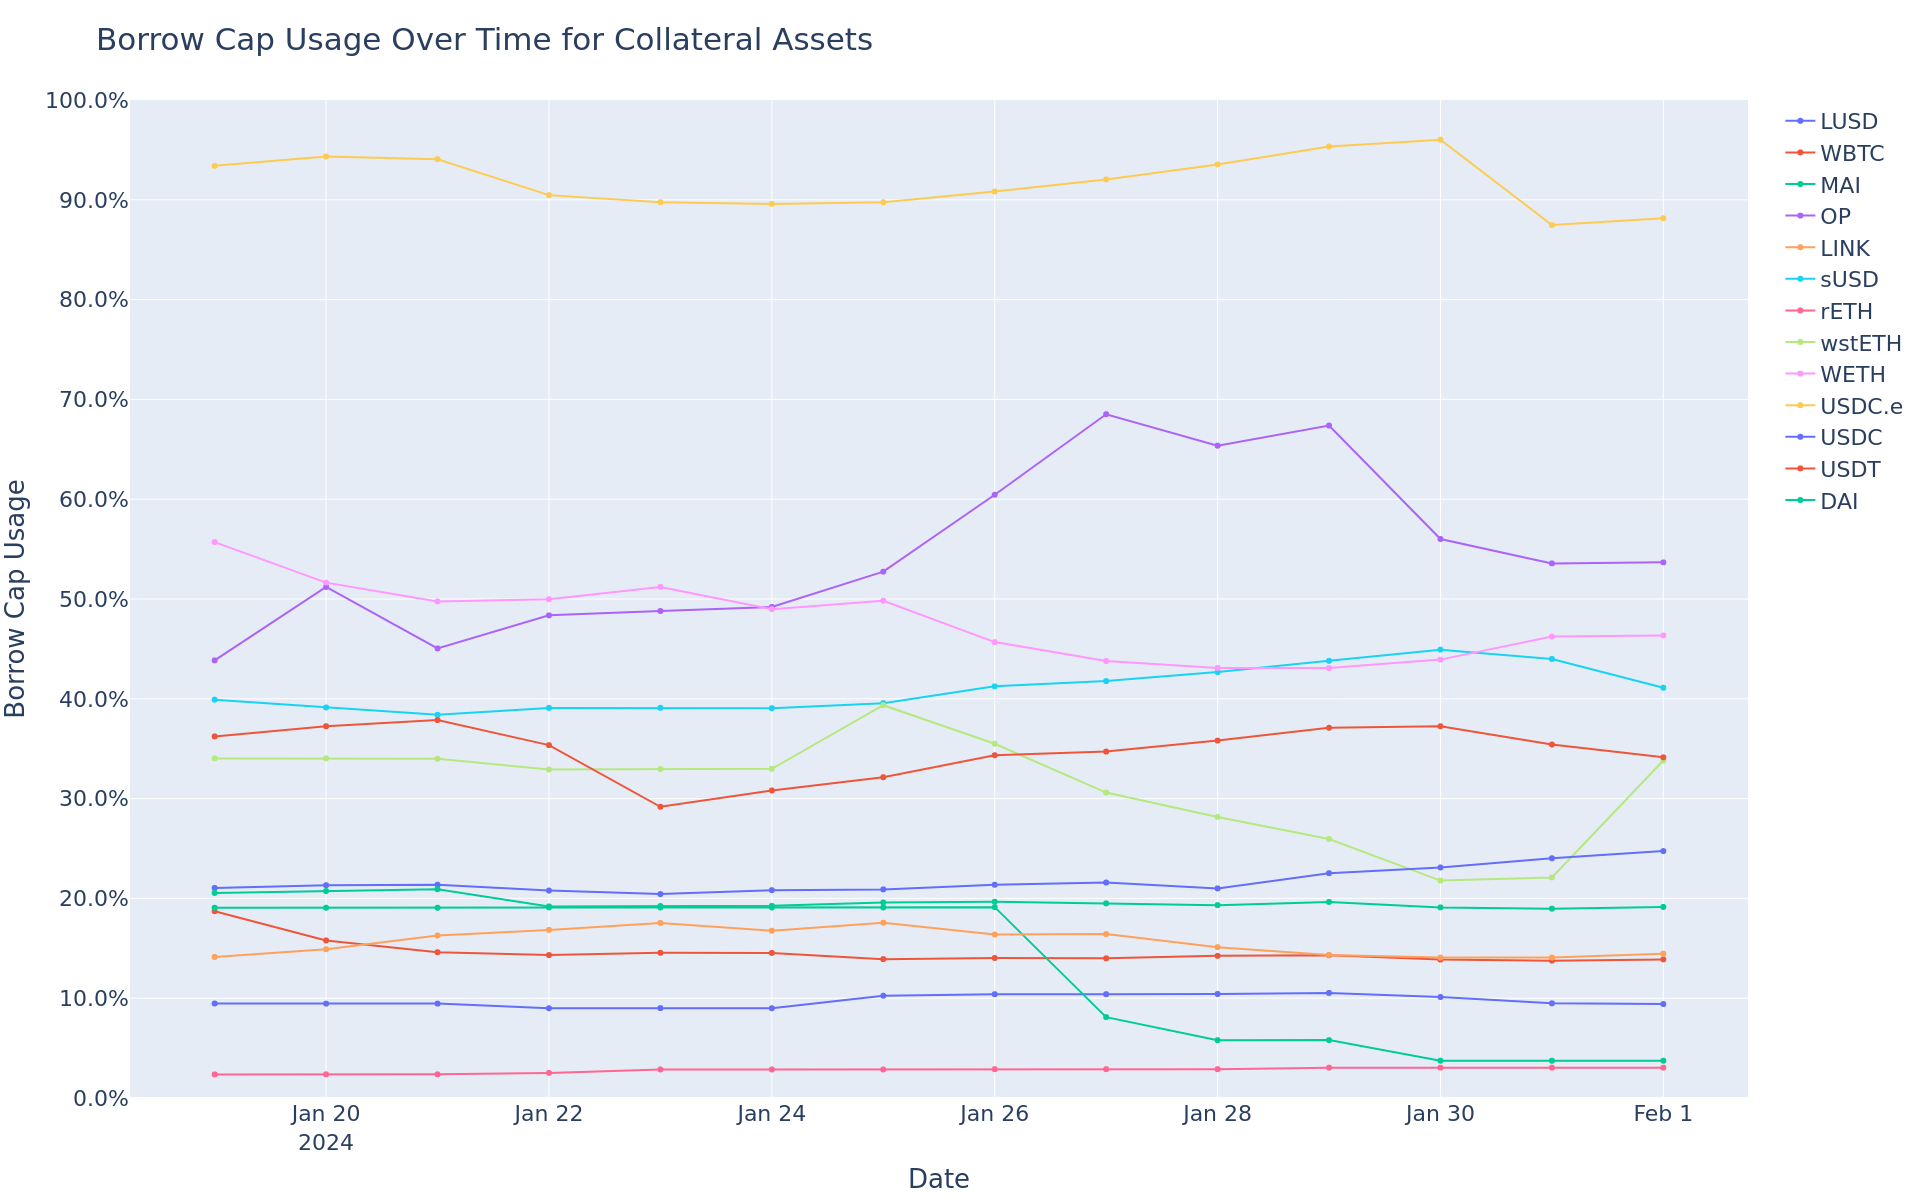
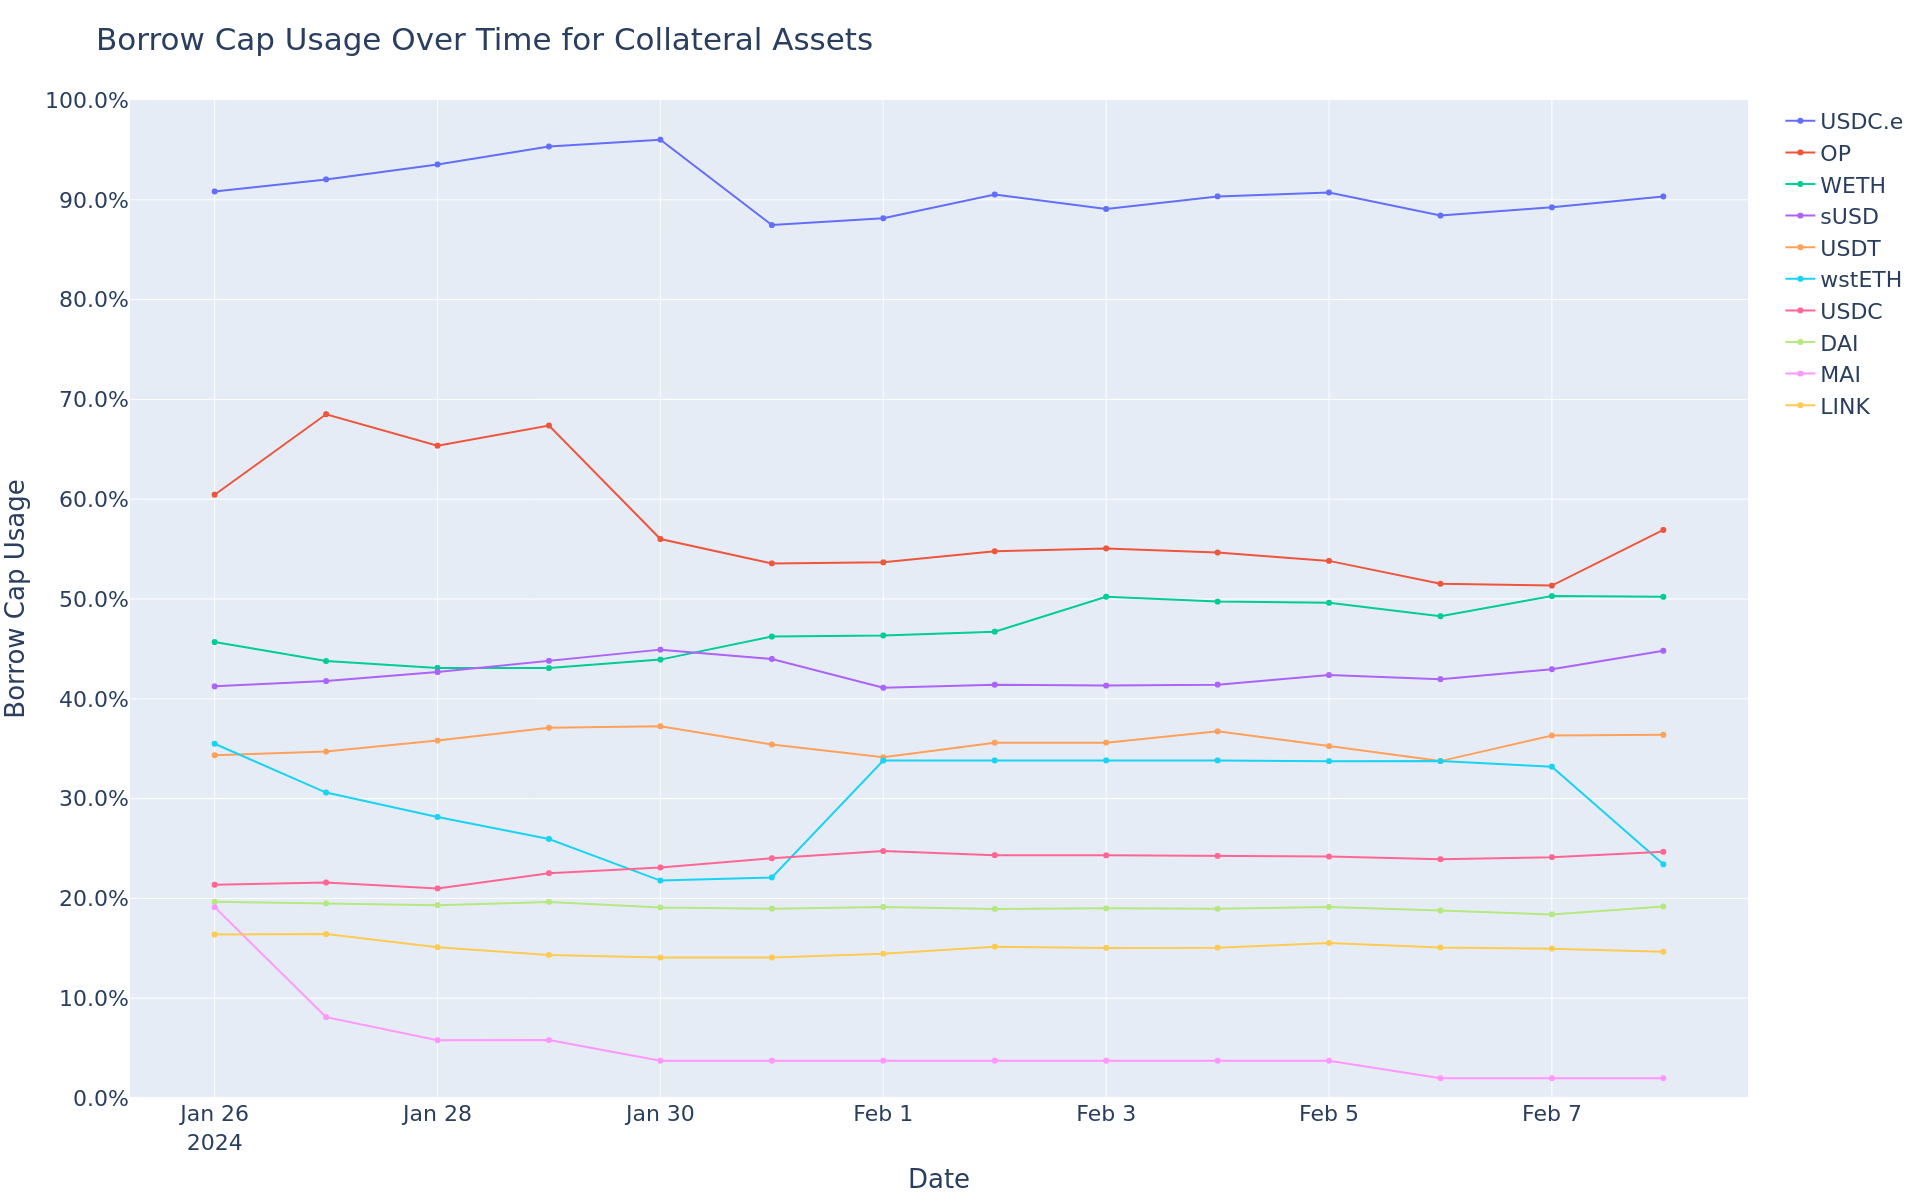
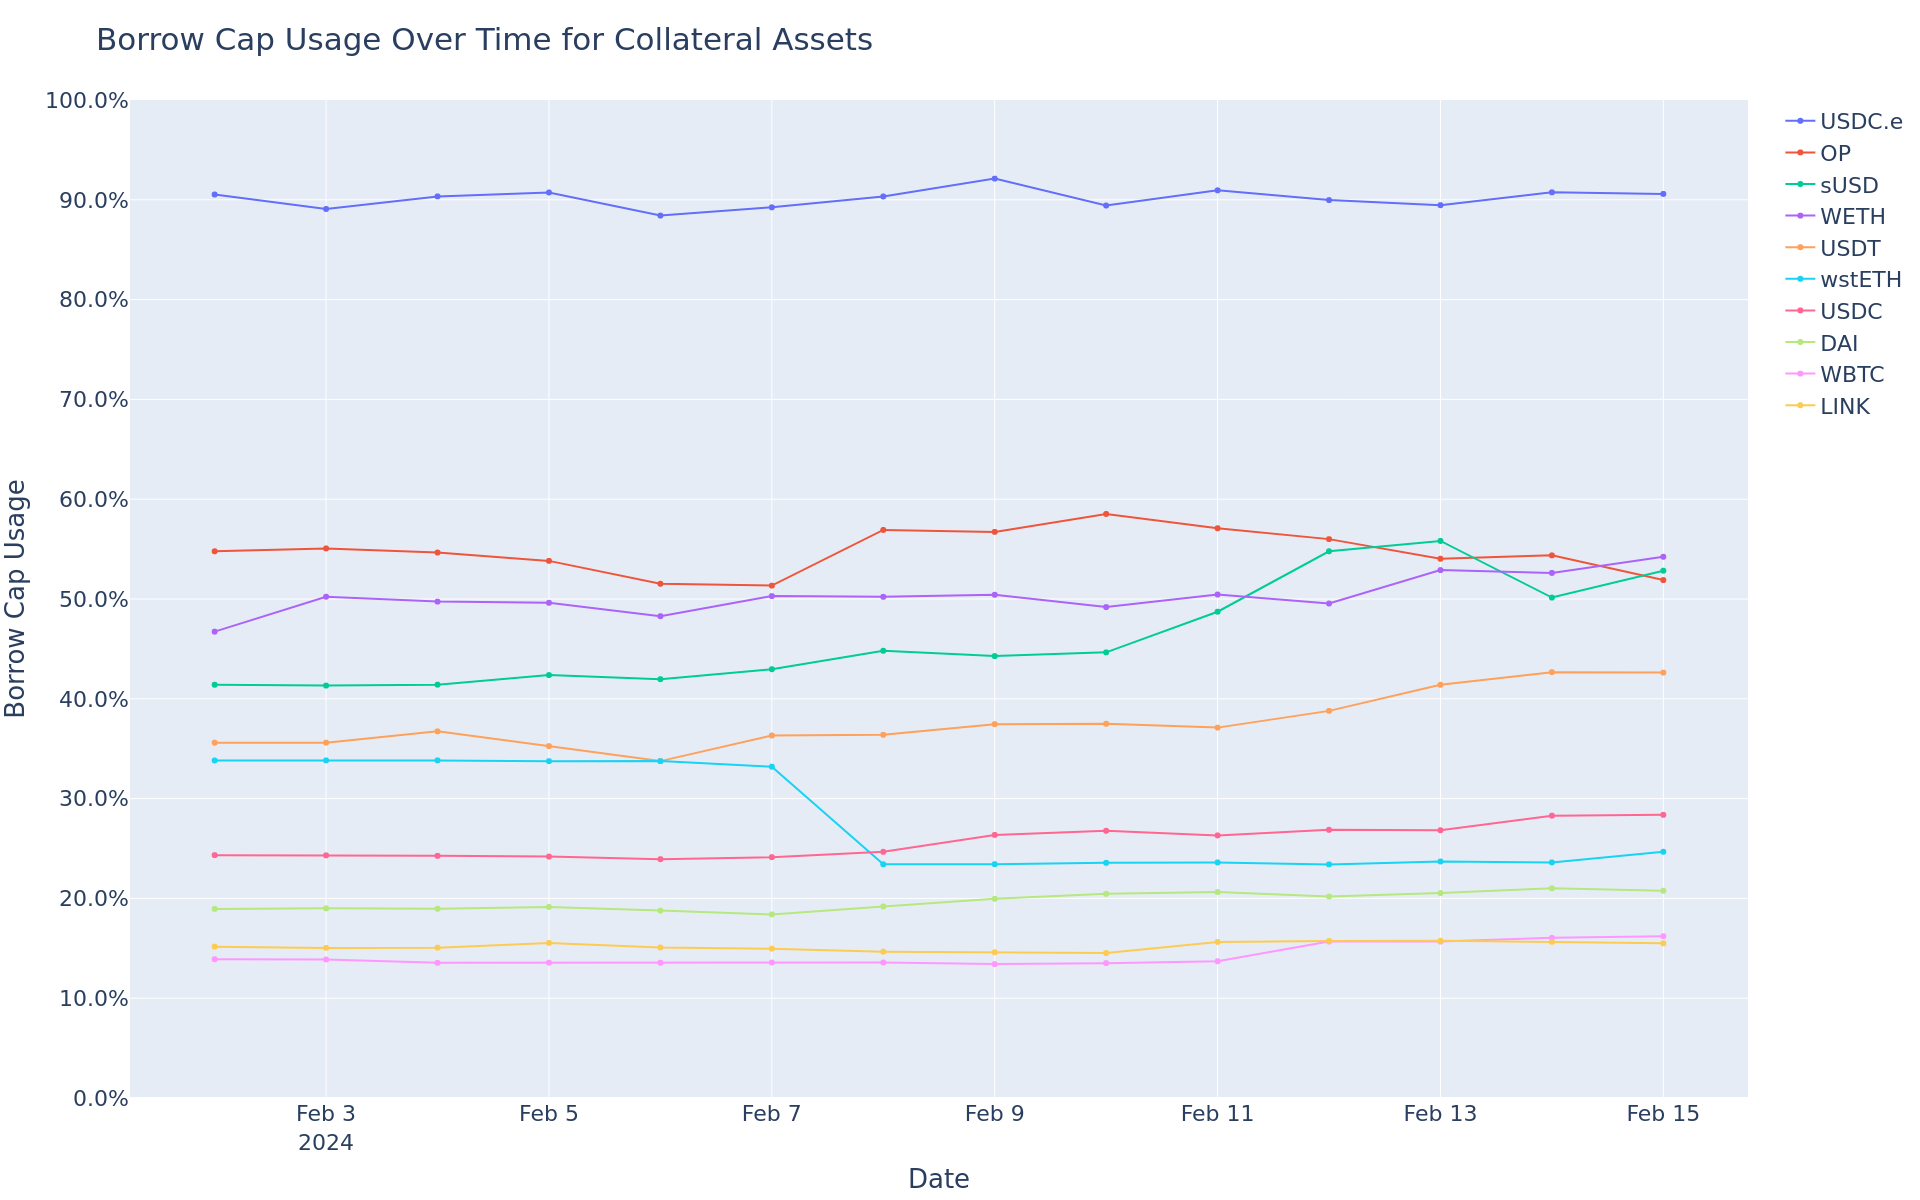
Borrow Cap Usage Trend
This graph shows the borrow cap usage (borrow / borrow cap) of all assets over the time frame in question.
[Gauntlet] Weekly Market Update - (2024-02-02 through 2024-02-08)
Gauntlet would like to provide the community with an update on this market over the previous week. Gauntlet is continuing to monitor this market. At this time, we do not recommend any parameter updates, but will keep the community informed.
Summary
This table gives high-level statistics over the time frame in question. Bold lines correspond to weekly average supply cap usage over 75%.
[Gauntlet] Weekly Market Update - (2024-02-09 through 2024-02-15)
Gauntlet would like to provide the community with an update on this market over the previous week. Gauntlet is continuing to monitor this market. At this time, we do not recommend any parameter updates, but will keep the community informed.
Summary
This table gives high-level statistics over the time frame in question. Bold lines correspond to weekly average supply/borrow cap usage over 75%.
Asset
Current Borrow Cap
Current Supply Cap
Average Borrow Cap Usage (Past Week)
Average Supply Cap Usage (Past Week)
Average Utilization
Current DEX 25% Slippage (USD)
USDC
20.00M
25.00M
27.11%
23.96%
90.55%
$983.12K
DAI
16.00M
25.00M
20.51%
14.31%
91.75%
$1.21M
USDT
16.00M
25.00M
39.65%
28.03%
90.53%
$2.24M
USDC.e
15.50M
18.00M
90.47%
86.68%
89.87%
$1.40M
sUSD
13.00M
20.00M
50.18%
39.74%
82.07%
$930.50K
LUSD
1.21M
3.00M
9.33%
4.55%
82.61%
$1.26M
OP
1.00M
10.00M
55.52%
55.21%
10.06%
$1.33M
LINK
84.00K
235.00K
15.34%
67.79%
8.09%
$323.89K
WETH
19.75K
35.90K
51.34%
45.28%
62.35%
$1.62M
wstETH
1.50K
34.50K
23.71%
47.66%
2.16%
$1.37M
rETH
720.00
6.00K
3.67%
21.22%
2.08%
$737.27K
WBTC
250.00
1.20K
14.89%
52.82%
5.87%
$1.12M
Top Movers
WBTC’s borrow balance increased WoW by 37% from $2M to $2M.
LUSD’s borrow balance decreased WoW by -4% from $115K to $111K.
WETH’s supply balance increased WoW by 23% from $38M to $46M.
LUSD’s supply balance decreased WoW by -3% from $139K to $135K.
WBTC’s utilization increased WoW by 14% from 6% to 6%.
OP’s utilization decreased WoW by -12% from 10% to 9%.
Key Interest Rates
Liquidations
Liquidated Asset
Liquidated Amount (Tokens)
Liquidated Amount (USD)
USDC
3.39K
$3.39K
DAI
2.86K
$2.86K
WETH
0.09
$249.53
OP
30.70
$109.55
LINK
0.34
$6.75
Weekly Annualized Reserve and Interest Projections
Supply Trend
This graph shows the total supply of all assets over the time frame in question. To see updated statistics, please see the live version of this graph here.
Borrows Trend
This graph shows the total borrows of all assets over the time frame in question. To see updated statistics, please see the live version of this graph here.
Utilization Trend
This graph shows the utilization (borrow / supply) of all assets over the time frame in question.
Supply Cap Usage Trend
This graph shows the supply cap usage (supply / supply cap) of all assets over the time frame in question.
Borrow Cap Usage Trend
This graph shows the borrow cap usage (borrow / borrow cap) of all assets over the time frame in question.