Summary:
A proposal to:
-
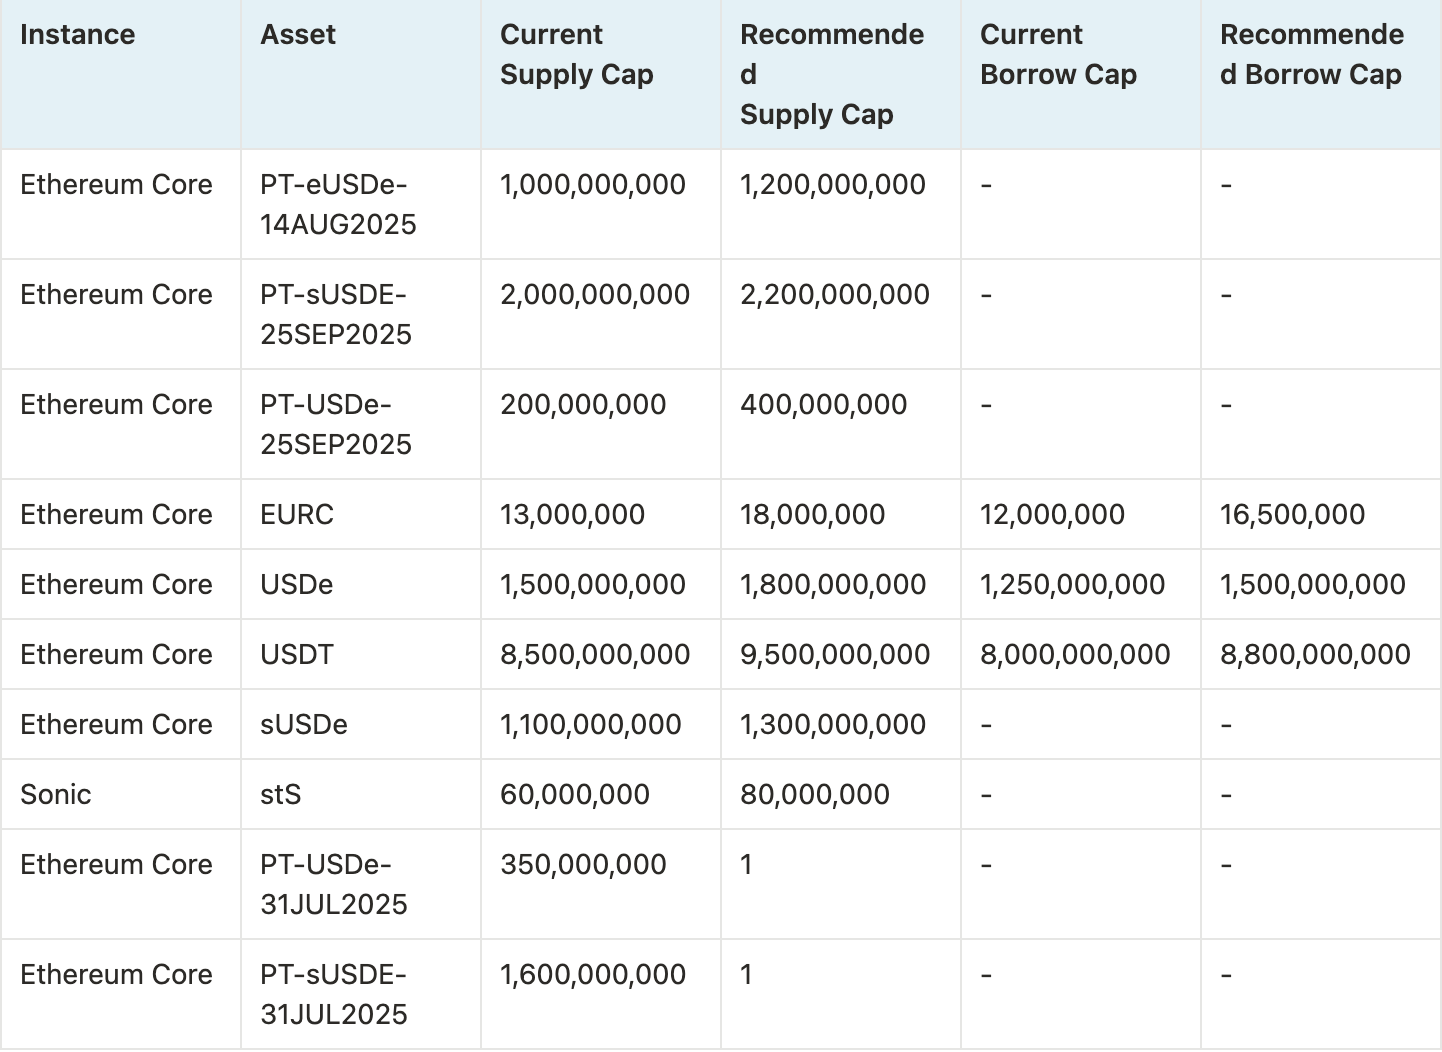
Increase the supply cap of PT-eUSDe-14AUG2025 on the Ethereum Core instance.
-
Increase the supply cap of PT-sUSDE-25SEP2025 on the Ethereum Core instance.
-
Increase the supply cap of PT-USDe-25SEP2025 on the Ethereum Core instance.
-
Increase the supply and borrow caps of EURC on the Ethereum Core instance.
-
Increase the supply and borrow caps of USDe on the Ethereum Core instance.
-
Increase the supply and borrow caps of USDT on the Ethereum Core instance.
-
Increase the supply cap of sUSDe on the Ethereum Core instance.
-
Increase the supply cap of stS on the Sonic instance.
-
Decrease the supply caps of expired PT tokens.
All cap increases are backed by Chaos Labs’ risk simulations, which consider user behavior, on-chain liquidity, and price impact, ensuring that higher caps do not introduce additional risk to the platform.
Our most recent research paper, “Stress Testing Ethena: A Quantitative Look at Protocol Stability,” examines how rapidly growing deposits of Ethena’s USDe, sUSDe and especially Pendle Principal Tokens are reshaping Aave’s collateral pool and funding dynamics. It maps out both on‑chain liquidity hazards (e.g., thin PT markets, leveraged looping, rehypothecation) and backing‑side tail risks (exchange or custodian failure, collateral de‑peg, prolonged negative funding) via scenario modeling and Monte‑Carlo simulations, while proving that Aave’s current risk‑oracle floors, eMode parameterization and liquidation controls would absorb most plausible shocks. The proposed cap increases reflect and incorporate the insights from this paper.
Finally, our most recent paper, “Aave’s Growing Exposure to Ethena: Risk Implications Throughout the Growth and Contraction Cycles of USDe ,” shows that contraction and stabilization dynamics within the Aave-Ethena ecosystem are closely linked. When sUSDe yields decline, leveraged positions unwind, freeing up significant stablecoin liquidity in Aave through repayments. Simultaneously, PT/USDe borrowers shift their debt into other stablecoins, generating upward price pressure on USDe precisely when redemption demand rises. Crucially, stablecoin repayments from leverage unwinders typically outweigh PT debt migration into stablecoins, creating a natural liquidity buffer. Our analysis indicates this dynamic effectively stabilizes Aave markets, comfortably absorbing potential stress even during Ethena’s withdrawal of backing assets. Overall, the current market structure supports increased exposure, provided backing deployment into Aave remains prudently managed. The proposed cap increases reflect and incorporate the insights from the aforementioned papers.
For more insight into how the PT Risk Oracle operates, please consult the following post and its follow up. In addition, the Risk Oracles outputs can be monitored live at the following page.
PT-eUSDe-14AUG2025 (Ethereum Core)
PT-eUSDe-14AUG2025 has reached its supply cap at 1B.


Supply Distribution
The supply of PT-eUSDe is not concentrated, with the top supplier accounting for only 12% of the total distribution. In addition, all top suppliers are borrowing USDe, USDT, or USDC, which are correlated assets, significantly reducing the risk of liquidations.

The largest borrowed asset against PT-eUSDe is USDe, aligning with our observation above. This significantly reduces the likelihood of large-scale liquidations.

Market & Liquidity
PT-eUSDe-14AUG2025’s Pendle AMM liquidity currently supports a 50M swap with less than 3% price slippage.

PT-eUSDe’s PT and SY liquidity have remained similar to our last review. On-chain liquidity for PT-eUSDe-14AUG2025’s pool has been stable at the $20–25M level, while SY liquidity has declined to around 50M.

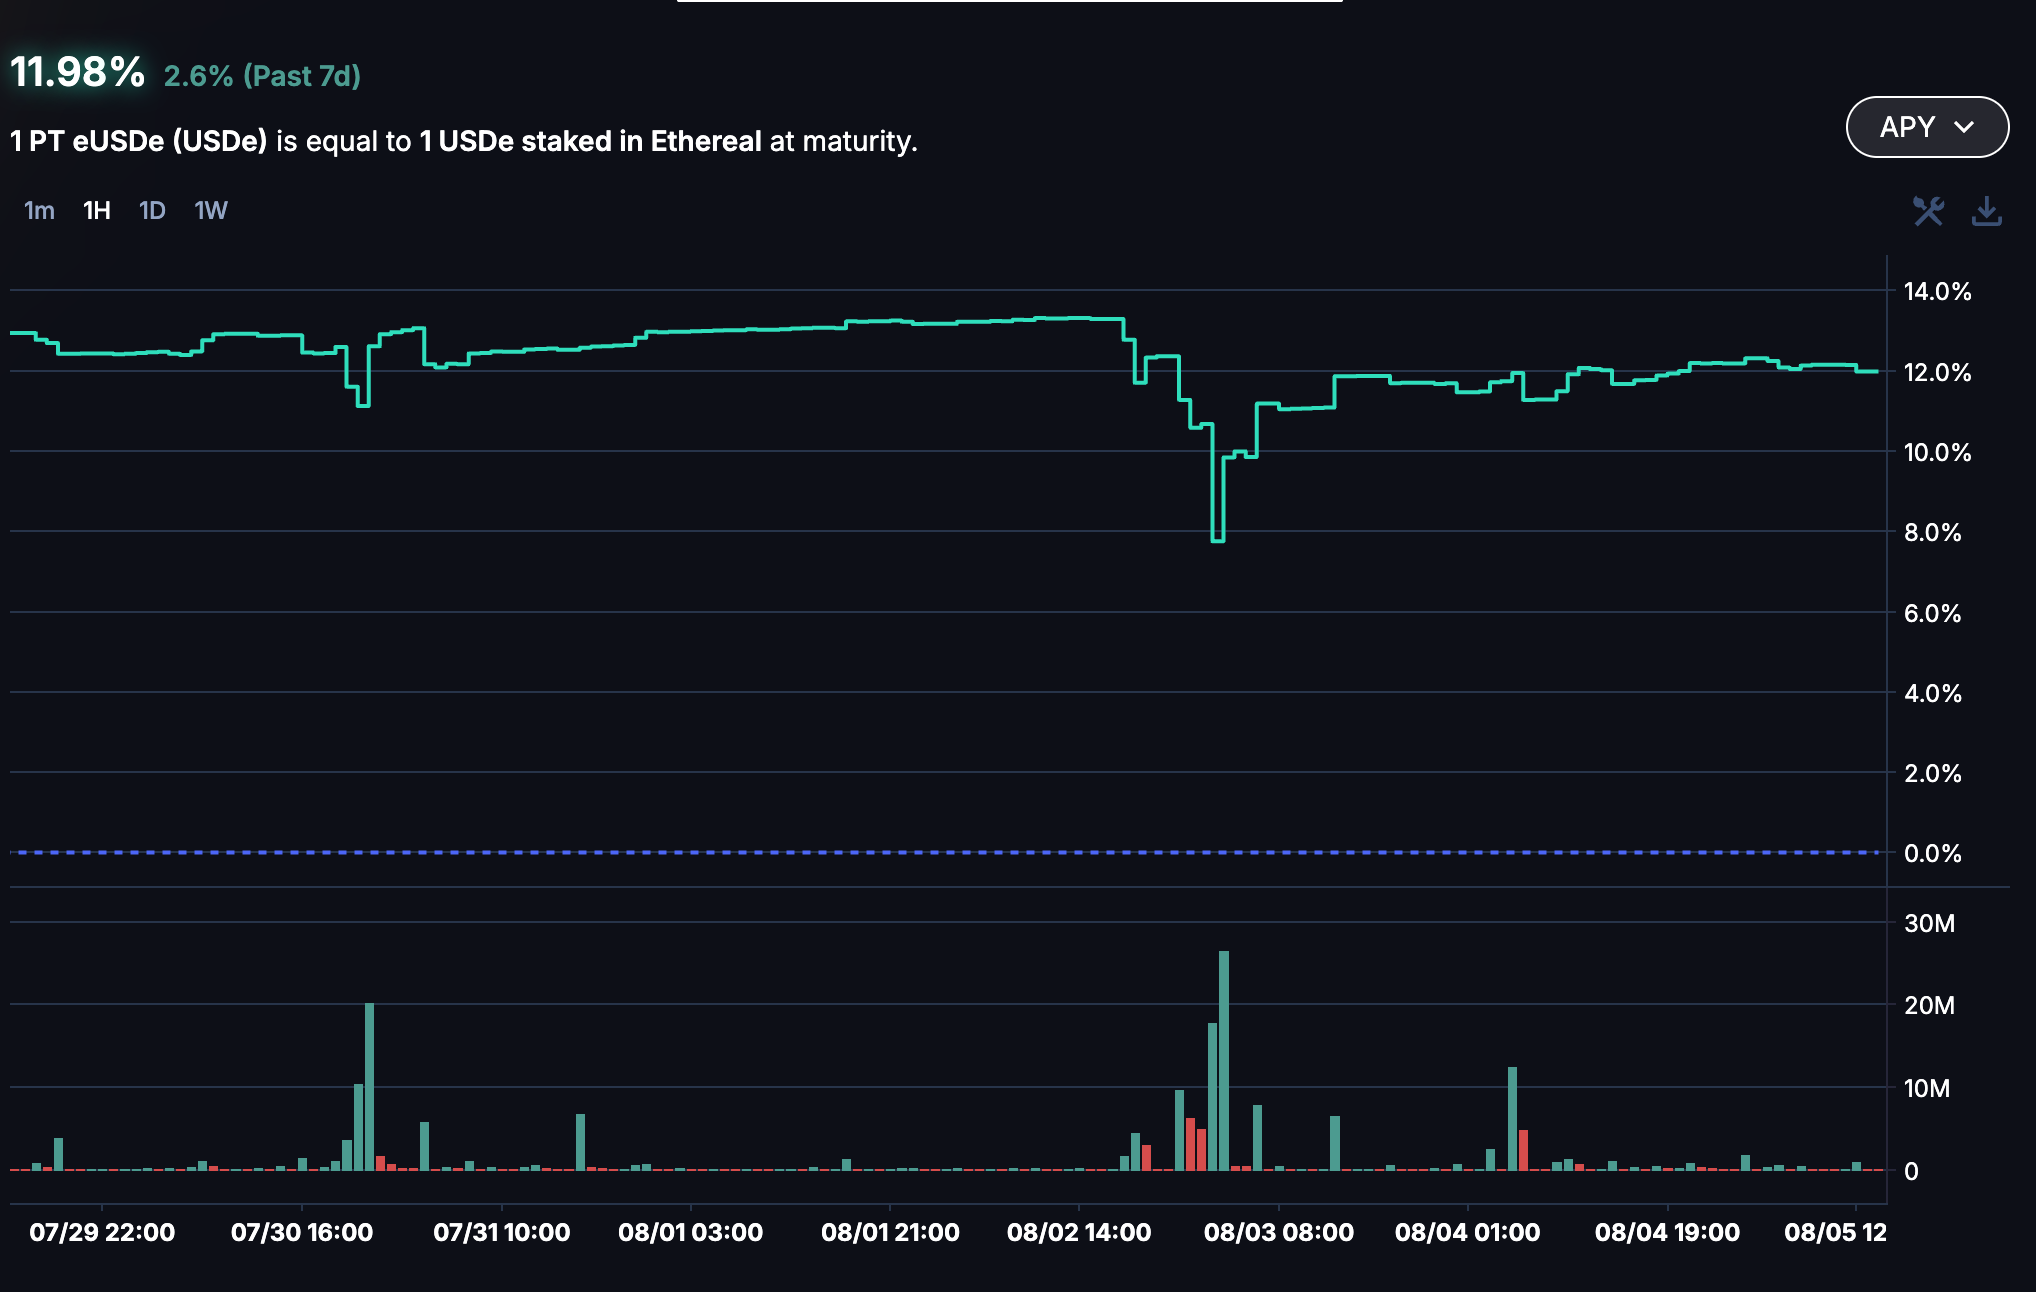
The implied yield has fluctuated over the past few weeks, remaining largely within the 10% to 12% range. While changes in implied yield do impact the prices of PTs, the actual price movement is minimal due to the short remaining duration (8 days), as shorter maturities significantly reduce sensitivity to yield fluctuations.
Recommendation
Considering user behavior, strong demand, and minimized risk associated with low duration, we recommend raising the supply cap by 200M.
PT-sUSDE-25SEP2025 (Ethereum Core)
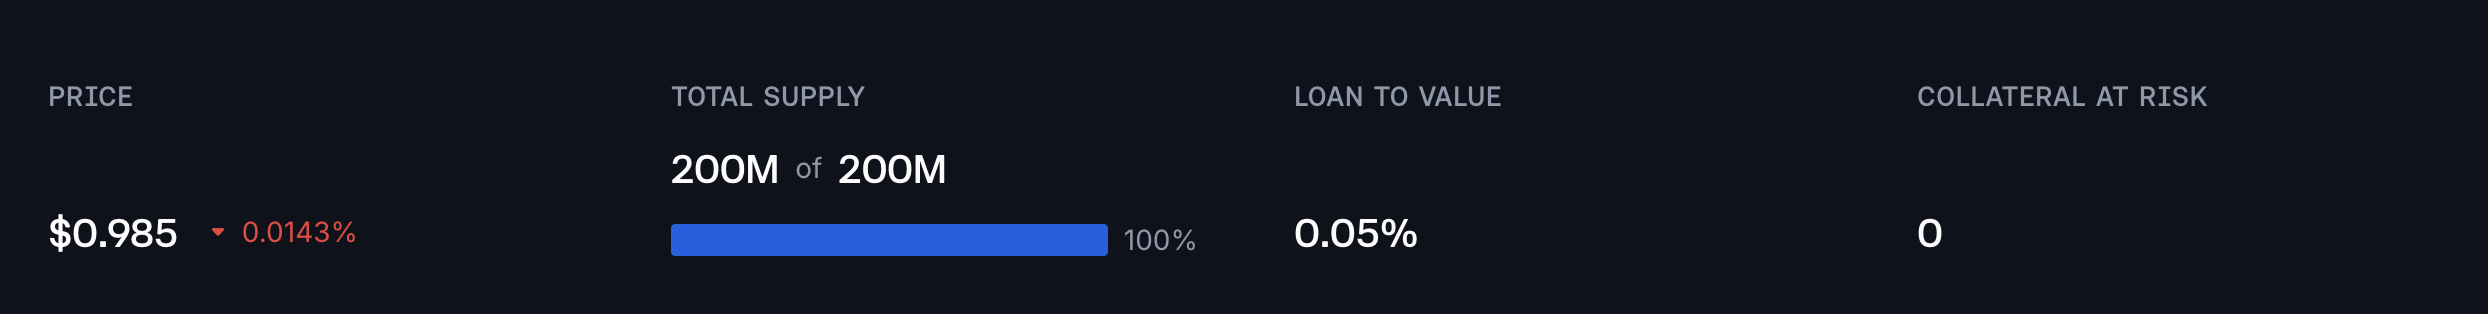
PT-sUSDE-25SEP2025 has reached 100% supply cap utilization.


Supply Distribution
The supply of PT-sUSDe presents no concentration risk, with the top supplier accounting for less than 6% of the total distribution. Additionally, all top suppliers are borrowing USDC, USDT, USDS, or USDe, which are correlated assets, thereby substantially reducing the current risk profile.

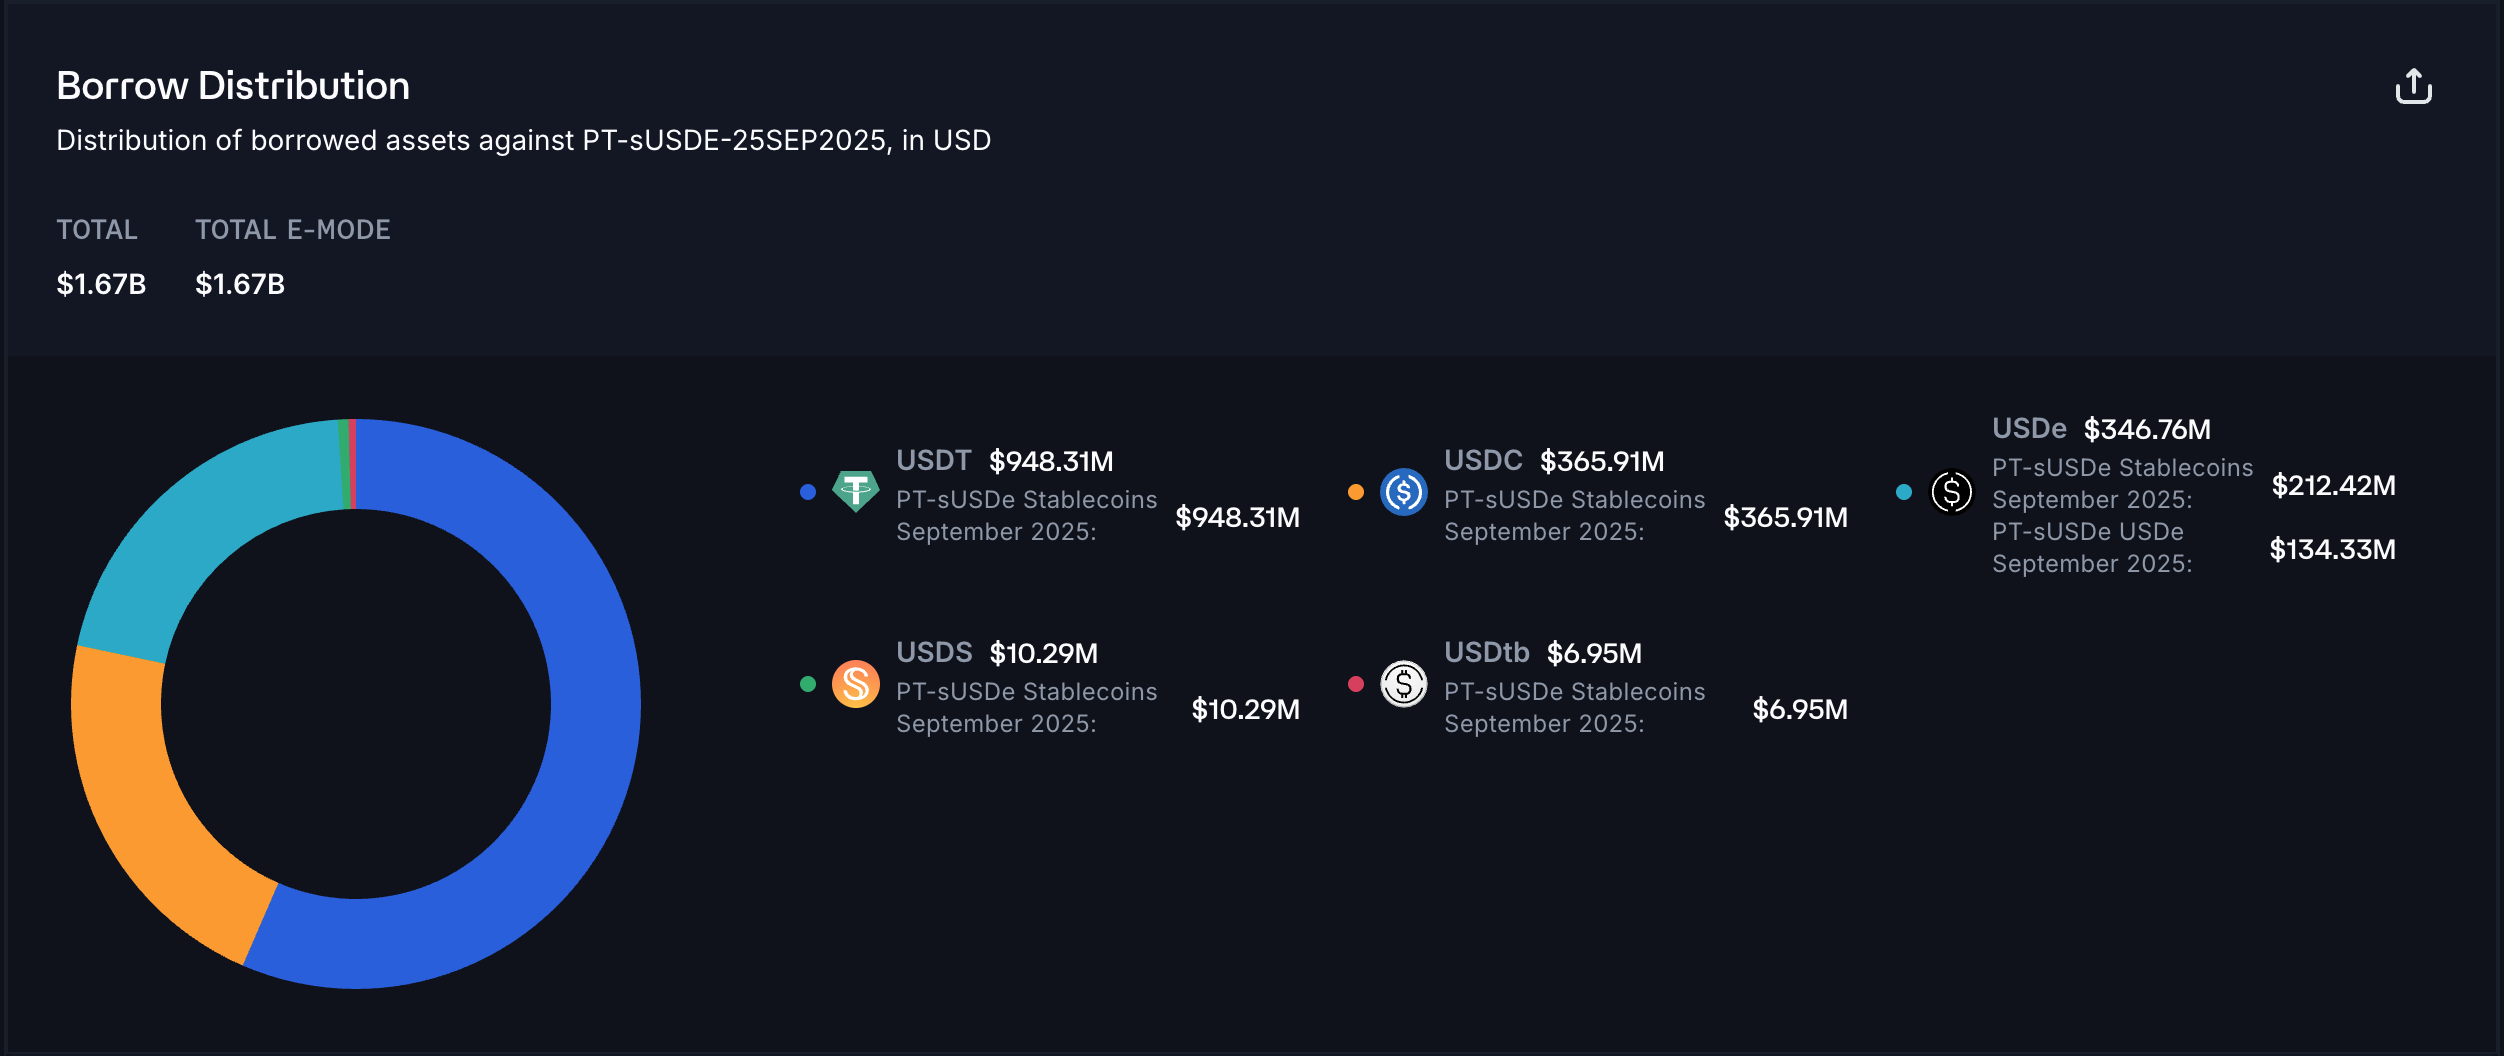
The largest borrowed asset against PT-sUSDe is USDT, accounting for around 57% of the total distribution.
Market & Liquidity
PT-sUSDe-25SEP2025’s Pendle AMM liquidity currently supports a 90M swap with less than 3% price slippage.

PT-sUSDe-25SEP2025’s on-chain liquidity has grown significantly since our last inspection, with SY liquidity reaching 90M and PT liquidity nearing 25M.

PT-sUSDE-25SEP2025’s implied yield has shown minor to moderate fluctuation over the past week, decreasing from 12% to around 10%. This change has only a limited effect on PT prices, largely due to the medium to short remaining maturity, which reduces price sensitivity to yield fluctuations as the PT price increasingly anchors to its redemption value.

Recommendation
Considering user behavior, market liquidity, and strong demand, we recommend raising the supply cap to 2.2B.
PT-USDe-25SEP2025 (Ethereum Core)
PT-USDe-25SEP2025 has reached 100% supply cap utilization, with deposits increasing by 100M in a single day.

Supply Distribution
The distribution of PT-USDe is moderately concentrated, with the top supplier accounting for 25% of the total distribution. However, since this user is borrowing USDT, we do not view this as posing any meaningful immediate risk.

All other top suppliers are either borrowing USDe or USDT, or have no borrowing activity, which substantially reduces the risk of liquidations.
The largest borrowed asset against PT-USDe is USDe, its underlying asset, which significantly reduces the likelihood of liquidations.

Market & Liquidity
PT-USDe-25SEP2025’s AMM can now support a 28M swap with slippage limited to 2%, reflecting an improvement since our last inspection.
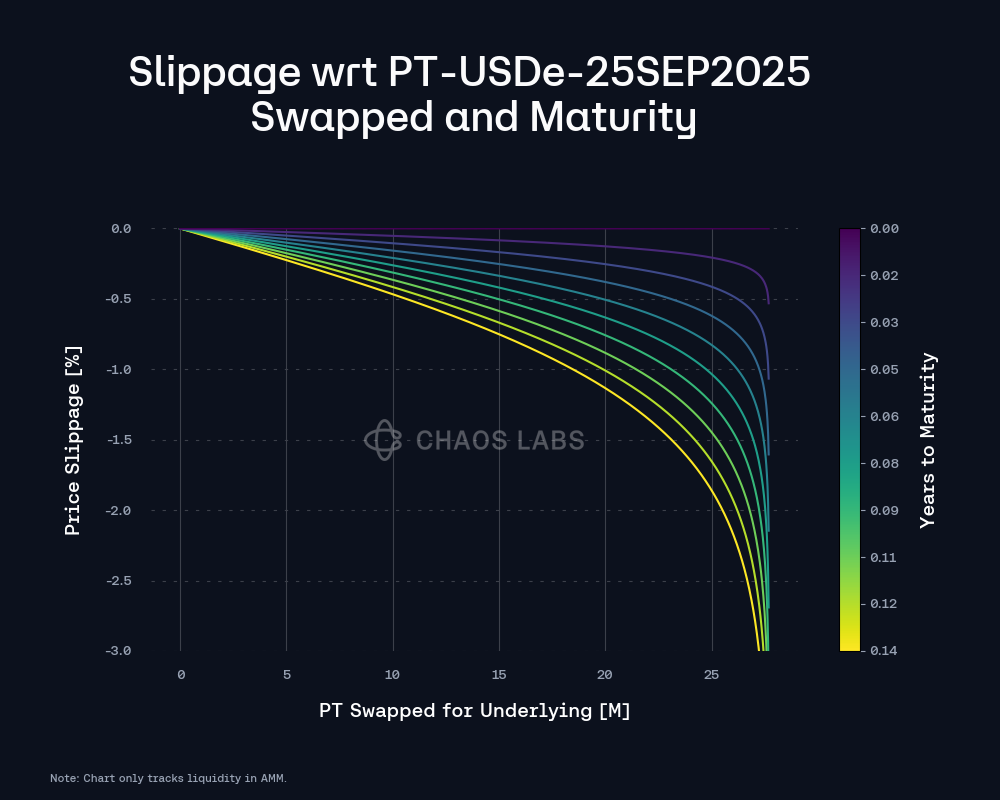
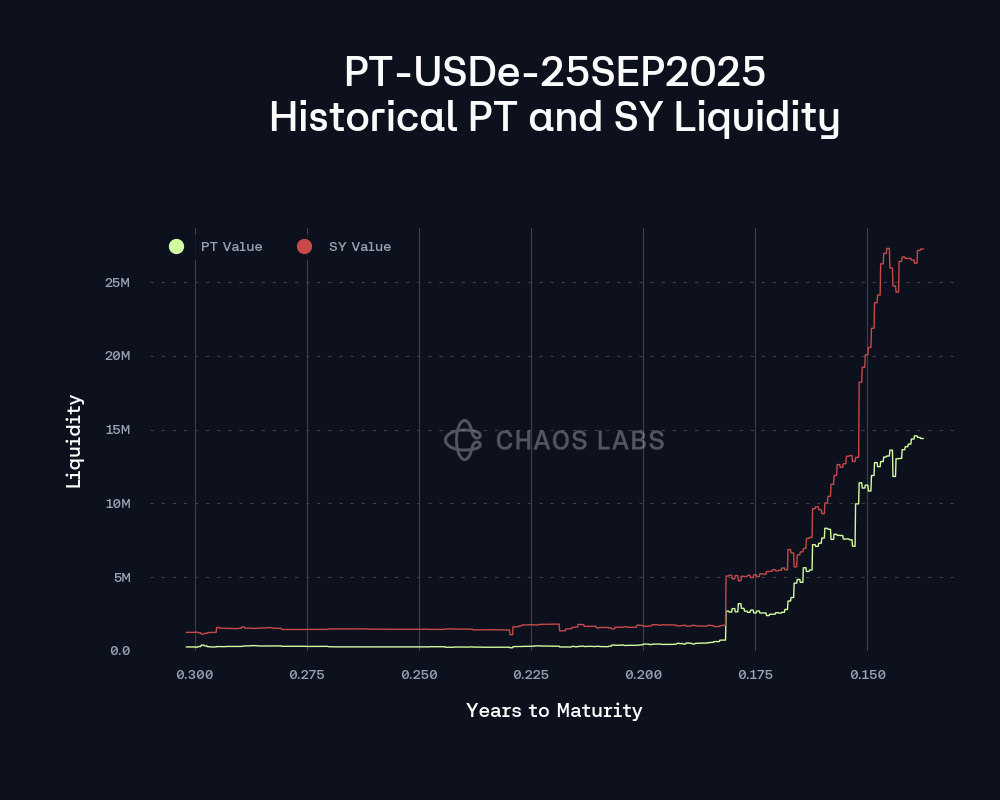
Additionally, liquidity for both PT and SY has shown healthy growth, recently reaching respective highs of 27M and 15M.
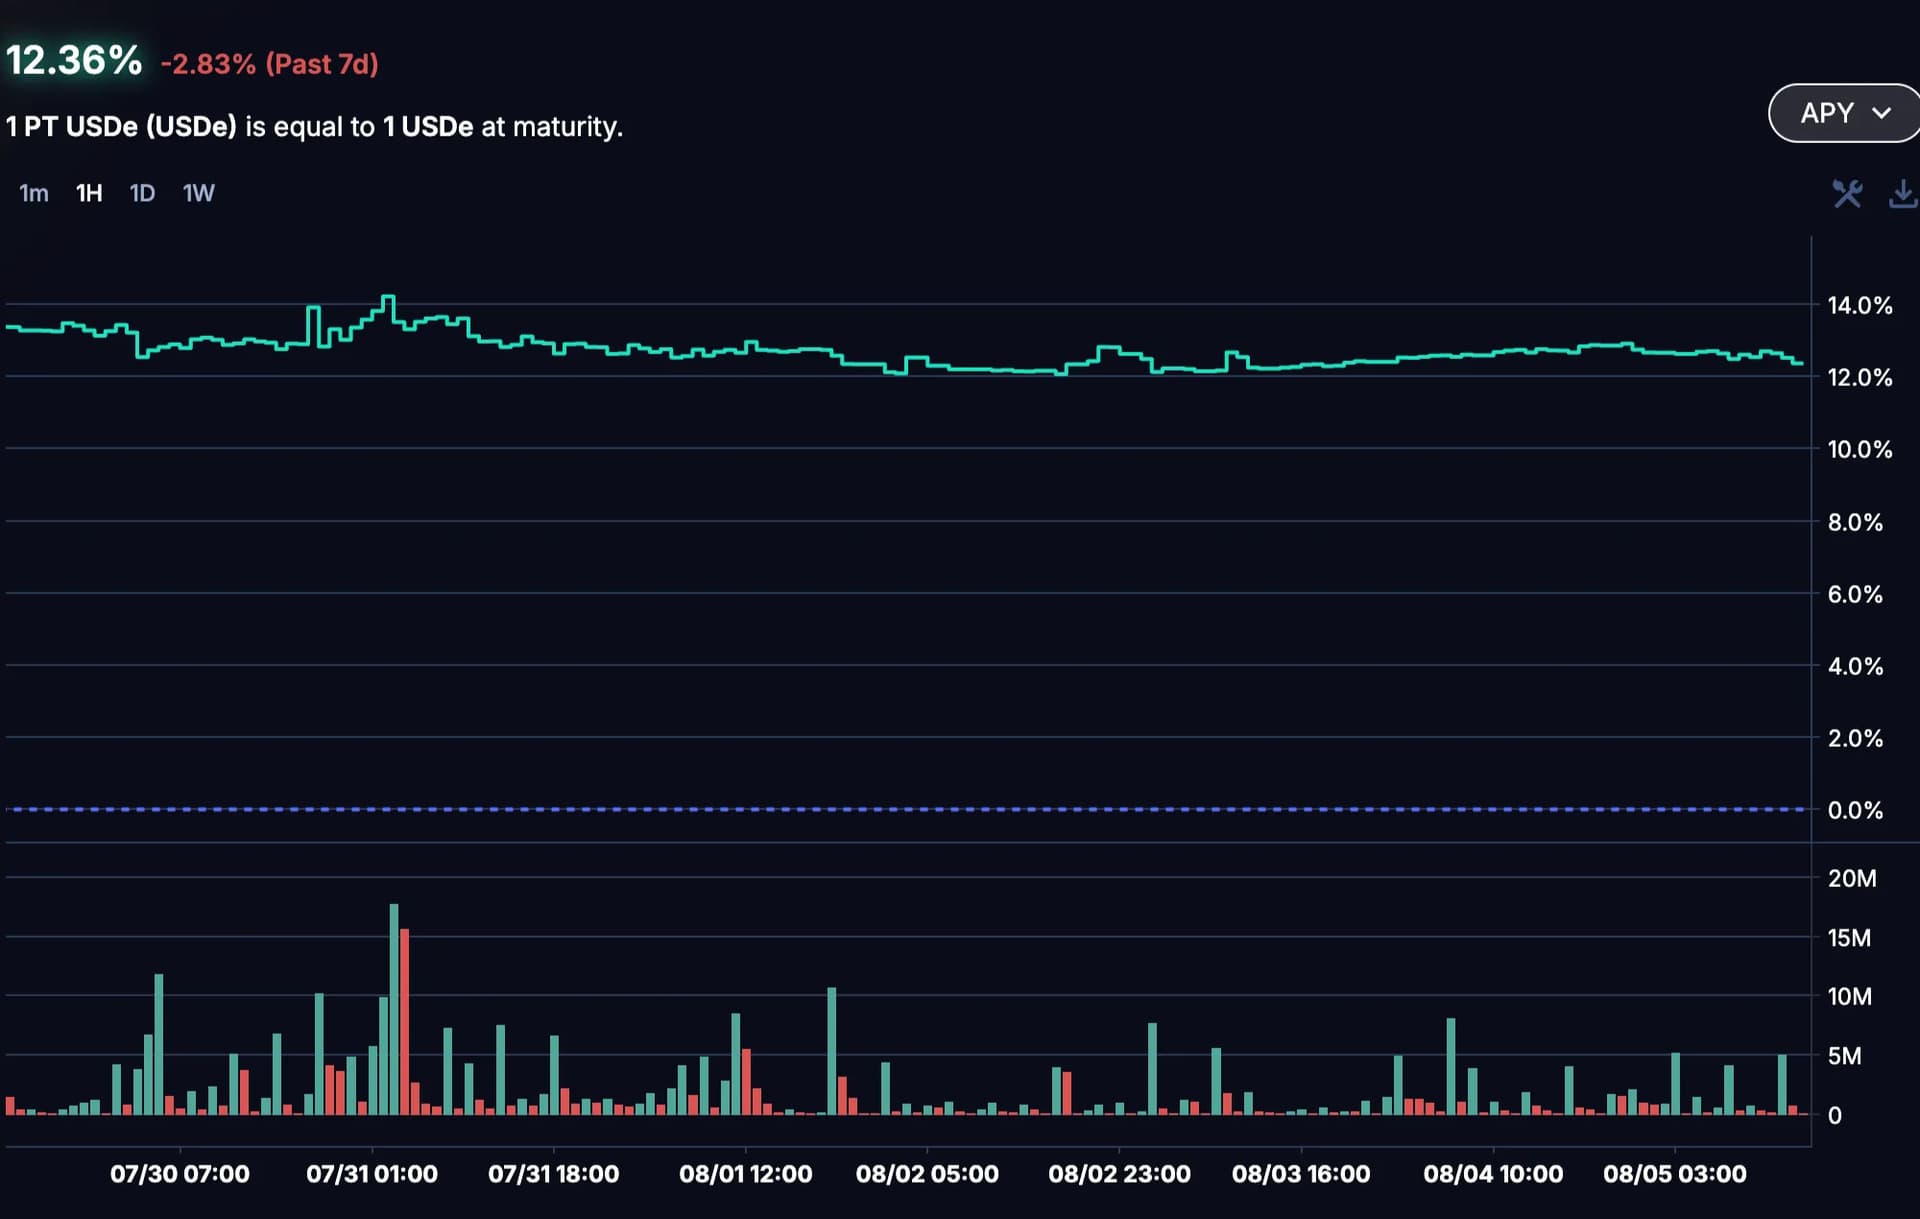
PT-USDe’s implied yield has remained stable over the past week, with limited fluctuations, hovering around 13%.
Recommendation
Considering user behavior, market liquidity, and strong demand, we recommend raising the supply cap to 400M.
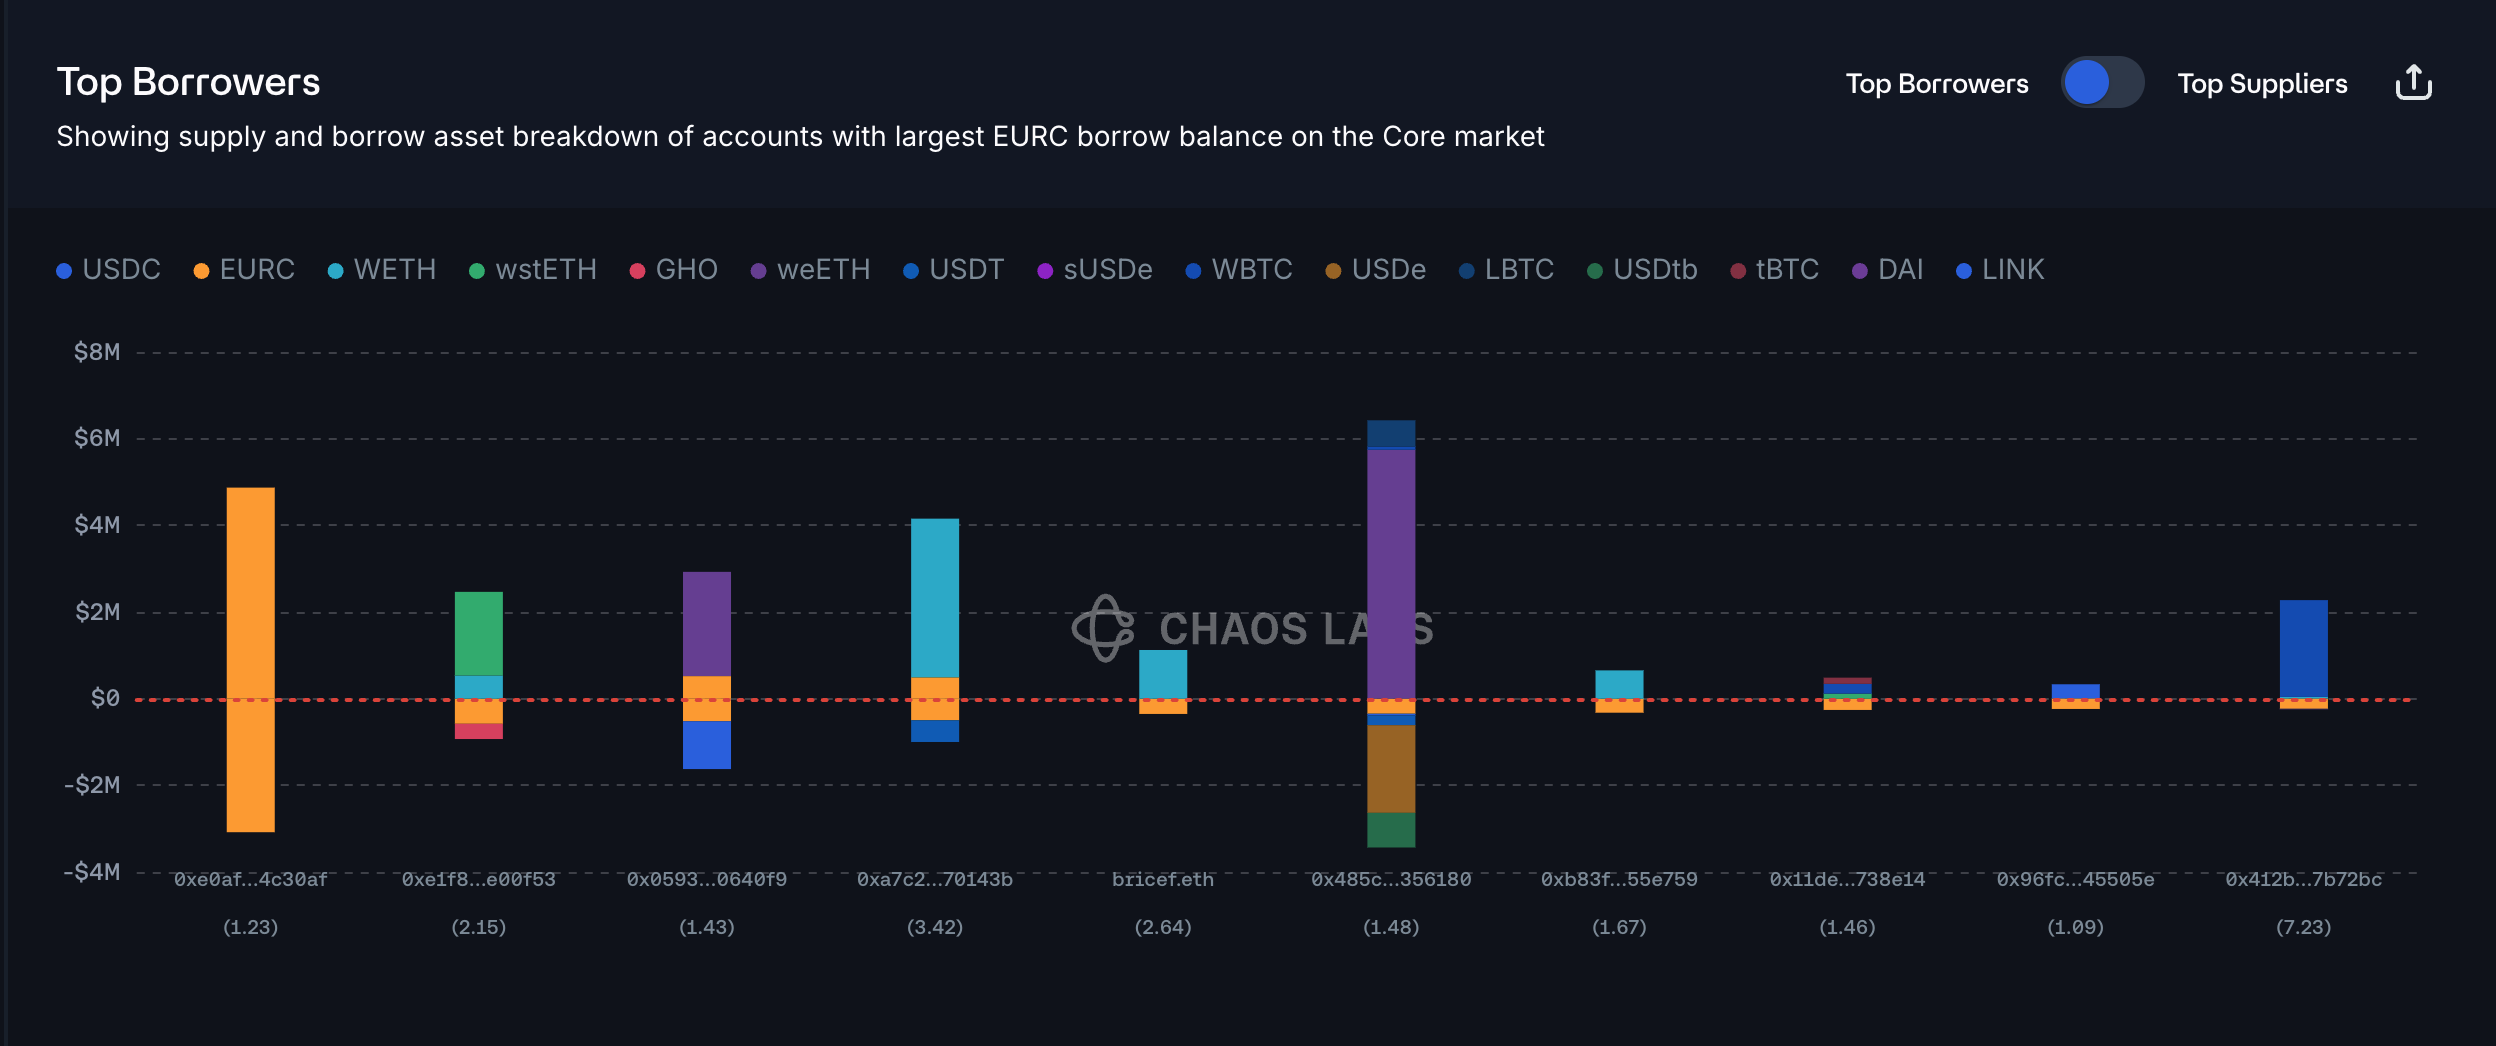
EURC (Ethereum Core)
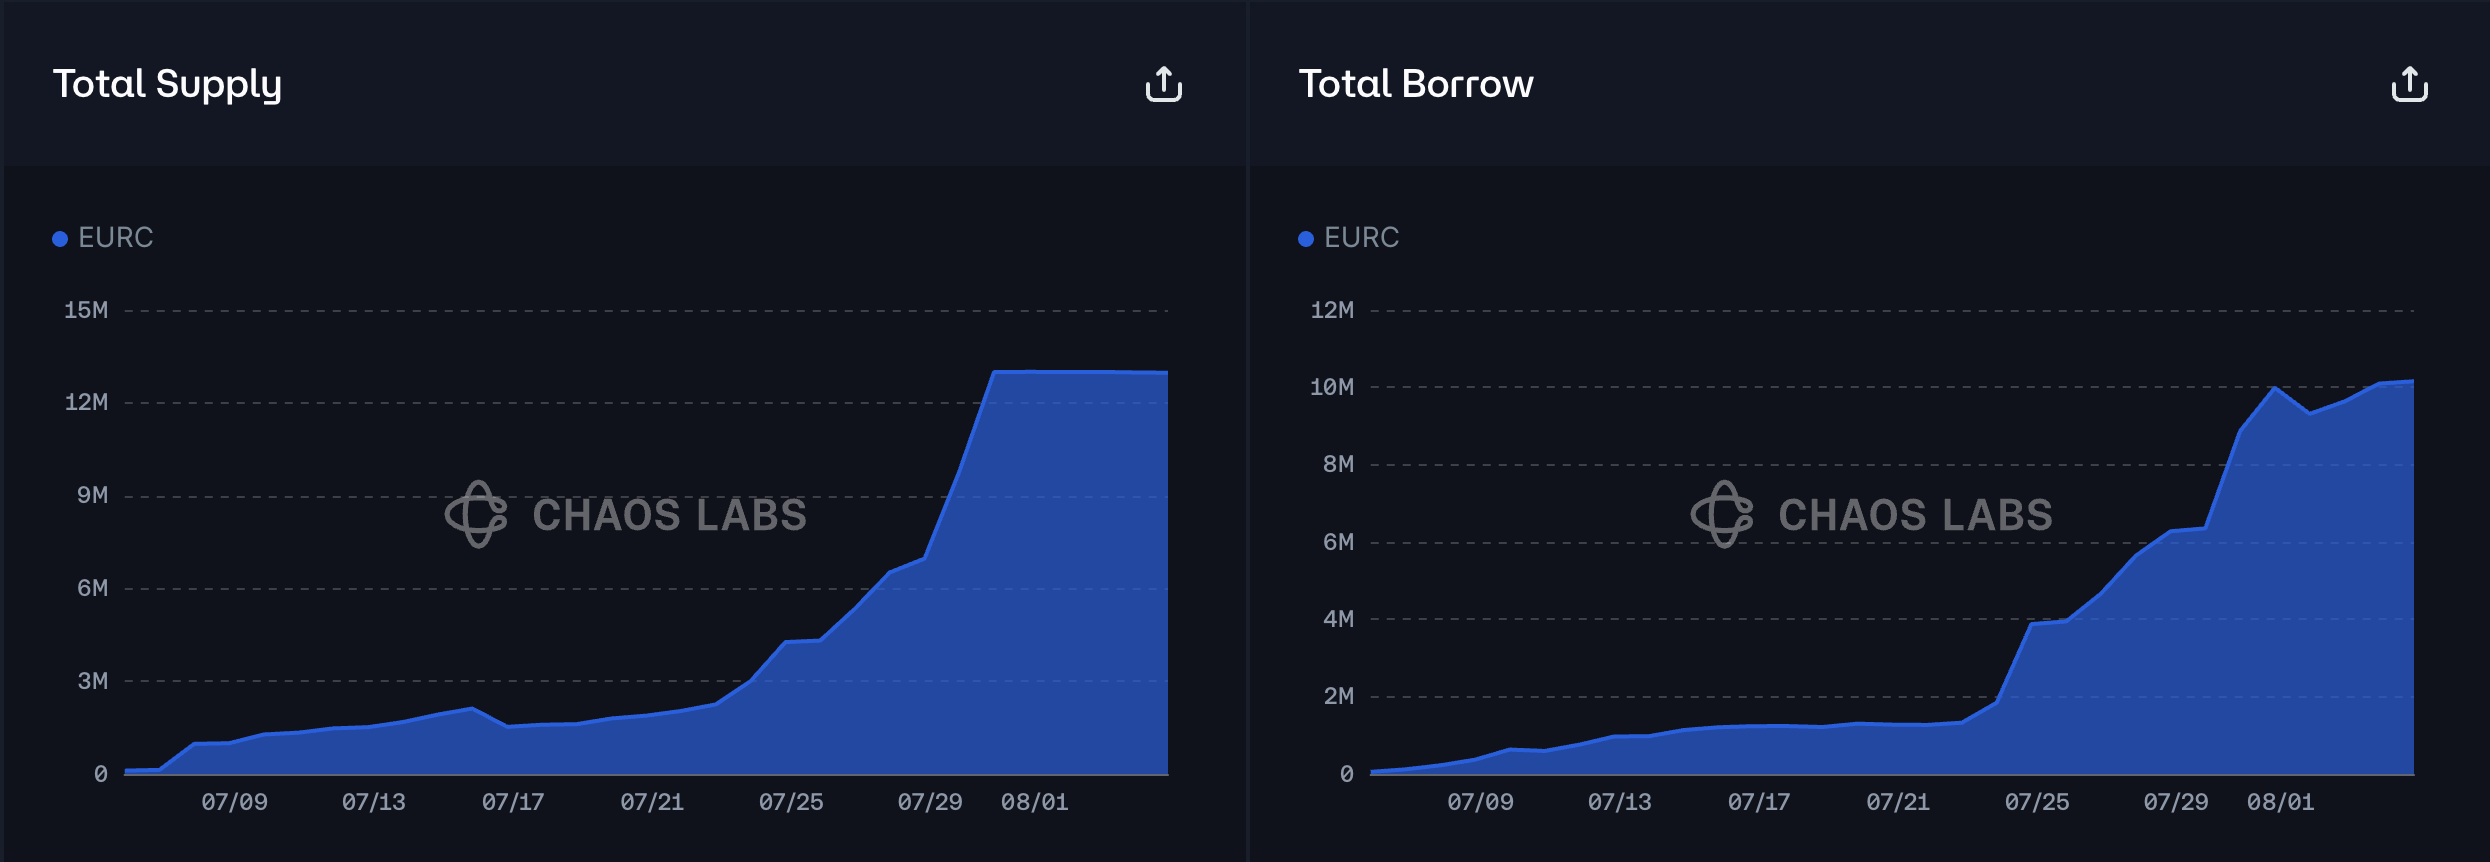
EURC has reached 100% supply cap utilization and 85% borrow cap utilization.

Supply Distribution
The supply of EURC shows a moderate concentration risk, with the top supplier accounting for around 30% of the total distribution. However, since this top supplier is borrowing EURC itself, we do not view this as an immediate risk.

The rest of the top suppliers are either borrowing stablecoins or have no borrowing activity, presenting limited risk at the moment. The only position outside of these patterns maintains a health score above 2, which significantly reduces the likelihood of liquidation.
The largest borrowed asset against EURC is EURC itself, which largely reduce the chance of large-scale liquidations.
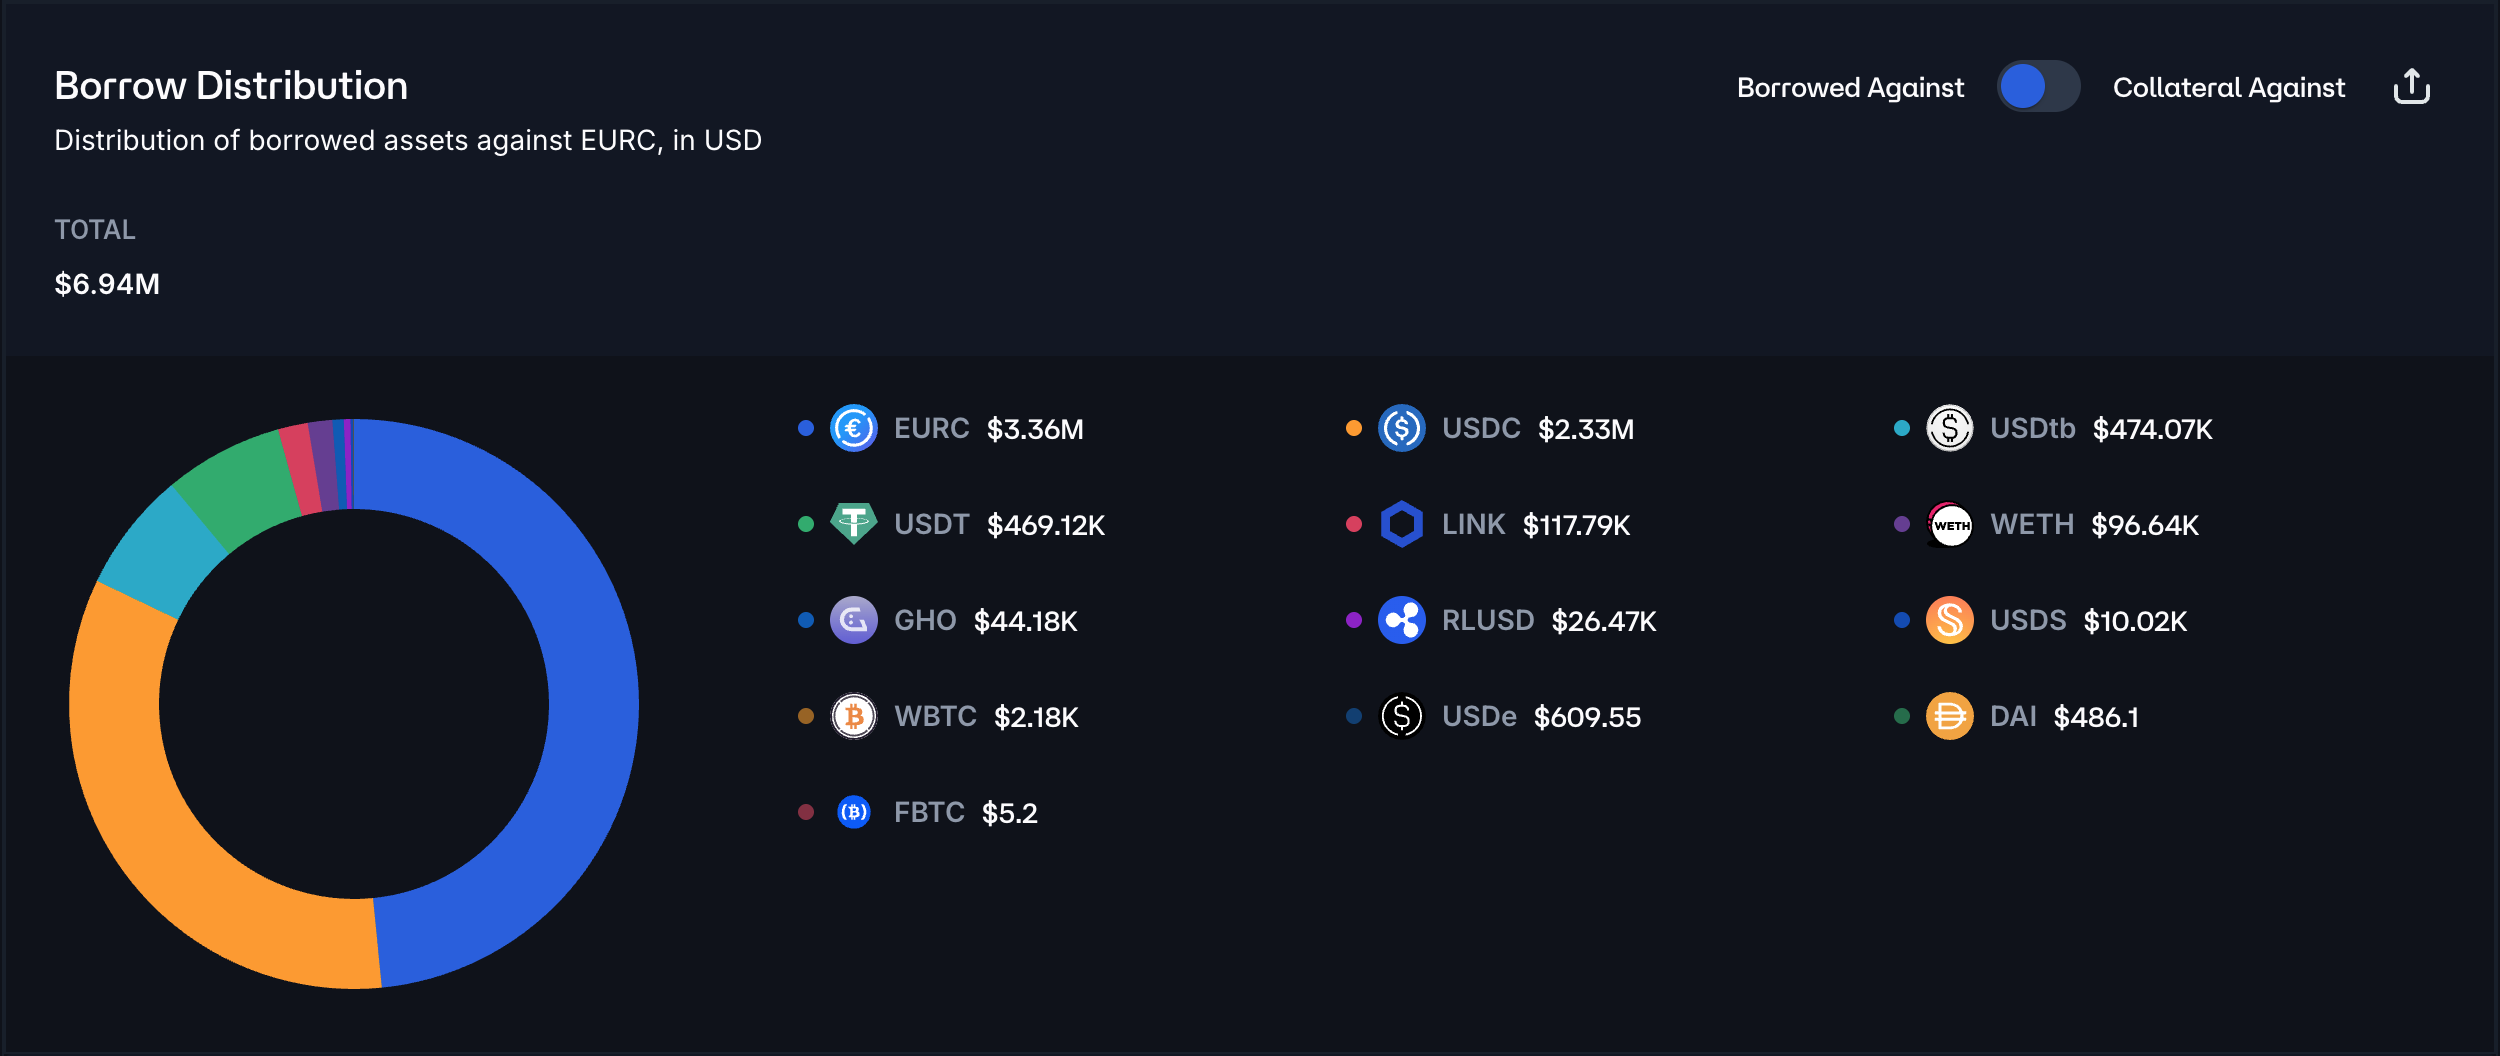
Borrow Distribution
The borrow distribution of EURC presents limited liquidation risk, as all top borrowers maintain robust health scores. The only user with a health score below 1.2 has collateralized USDC, which significantly reduces the likelihood of liquidation.
Liquidity
EURC’s on-chain liquidity can currently support selling 6M EURC for USDC with less than 5% price slippage, supporting the case for the cap increase.
Recommendation
Given the user-behavior and on-chain liquidity, we recommend increasing EURC’s supply and borrow caps.
USDe (Ethereum Core)
USDe has reached 100% supply cap utilization, while its borrow cap utilization stands at 87%


Supply Distribution
The supply distribution of USDe is not concentrated, with the top supplier accounting for only 10% of the total distribution. In addition, all top suppliers are borrowing correlated assets such as USDe, USDS, USDC, and USDT, which significantly reduces the likelihood of liquidation.
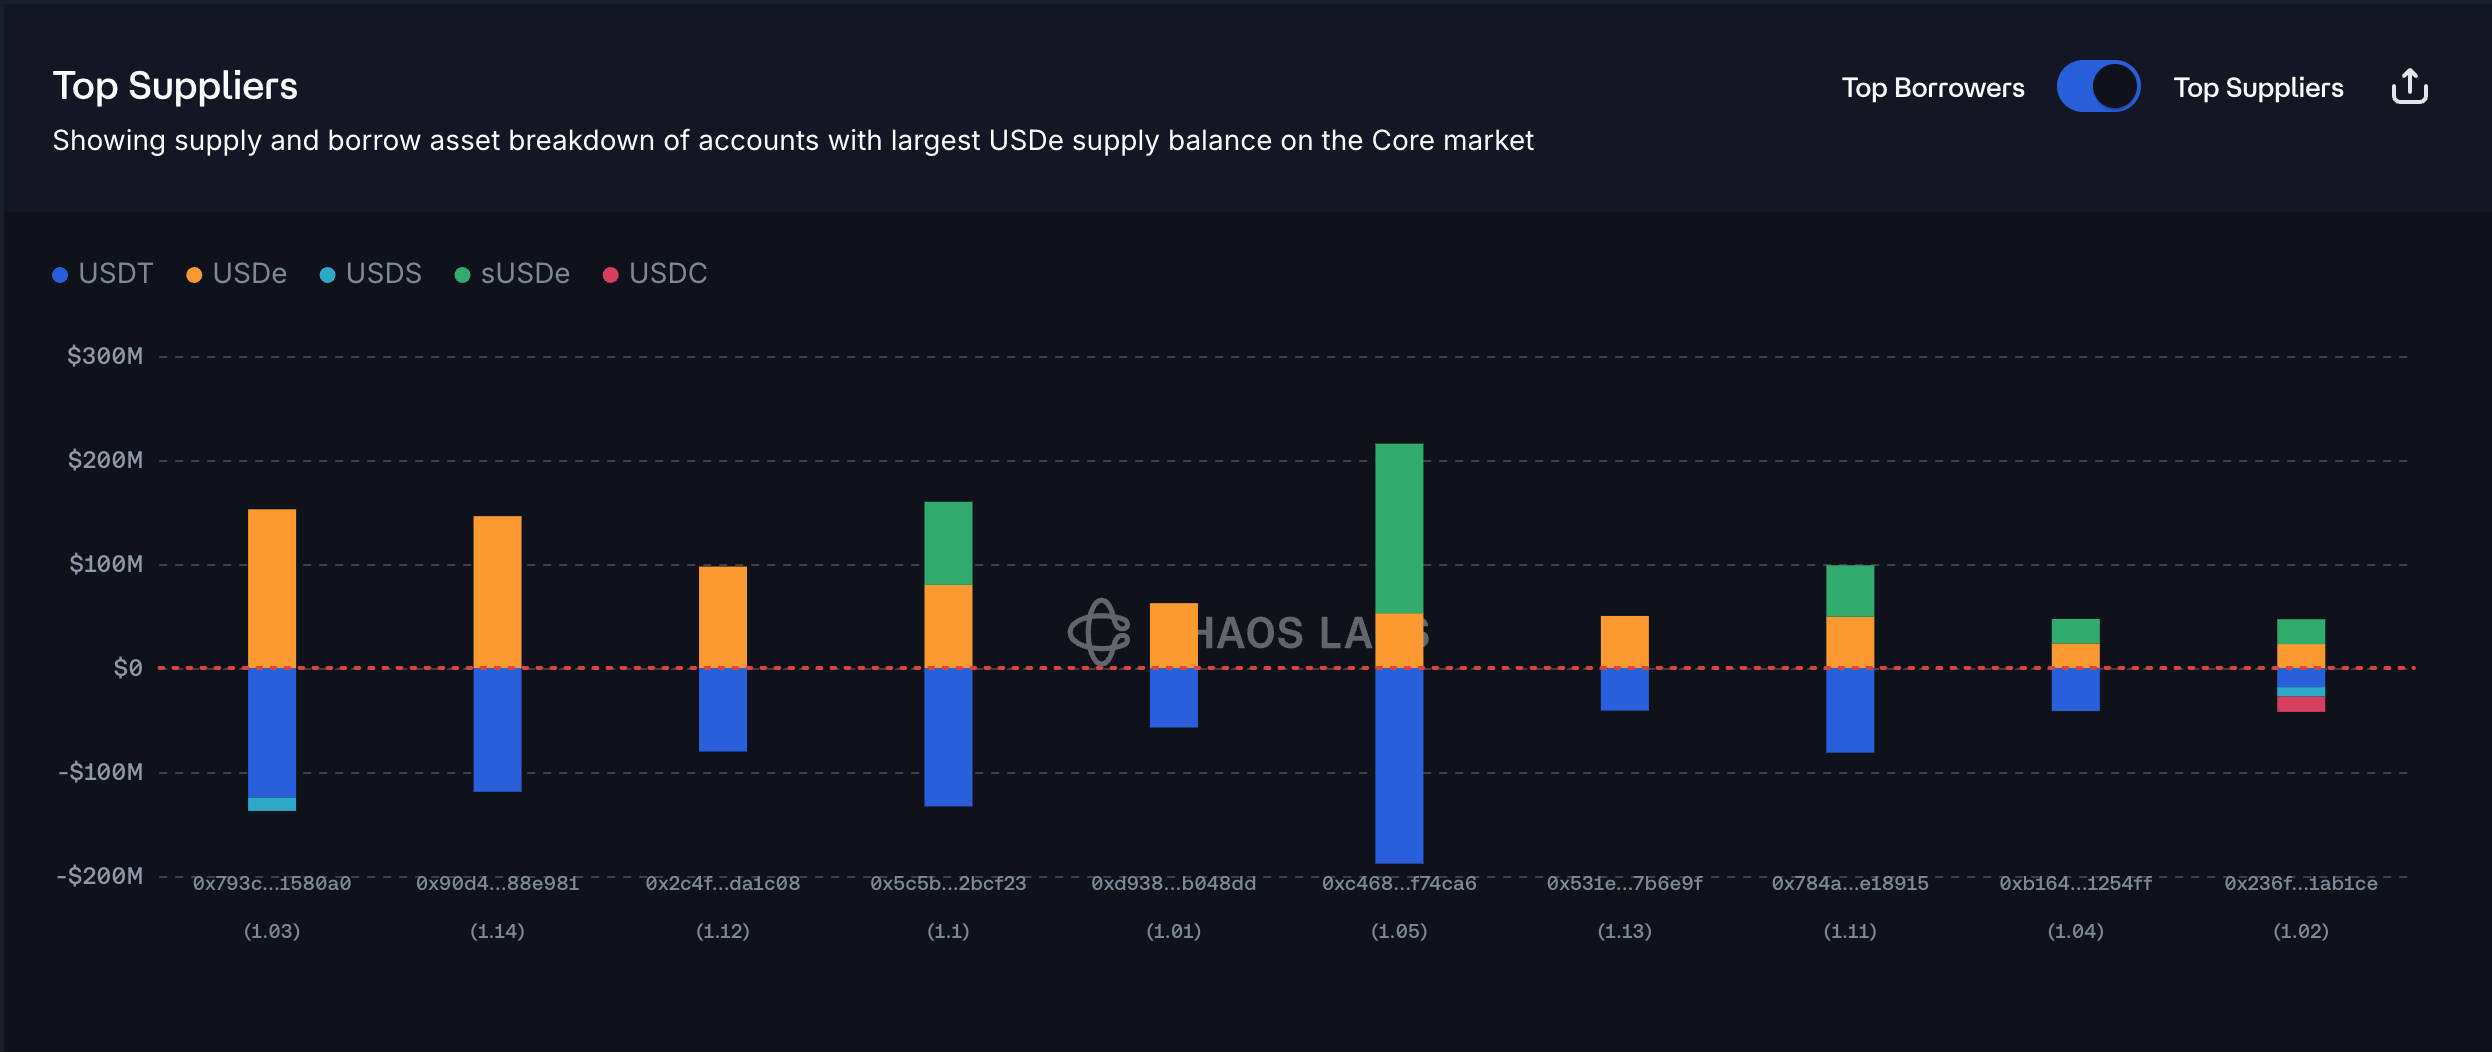
The largest borrowed asset against USDe is USDT, accounting for 90% of the total borrowed asset distribution.

Borrow Distribution
The borrow distribution of USDe also shows no signs of concentration, with the top borrower accounting for only around 10% of the total distribution. Furthermore, since these top borrowers are either collateralizing correlated PT assets or maintaining high health scores, we believe the risk of liquidation is low.

Liquidity
USDe’s liquidity has remained generally stable over the past three months. Currently, selling 20M USDe would incur less than 1% price slippage.

Recommendation
Given the user-behavior and on-chain liquidity, we recommend increasing USDe’s supply and borrow caps.
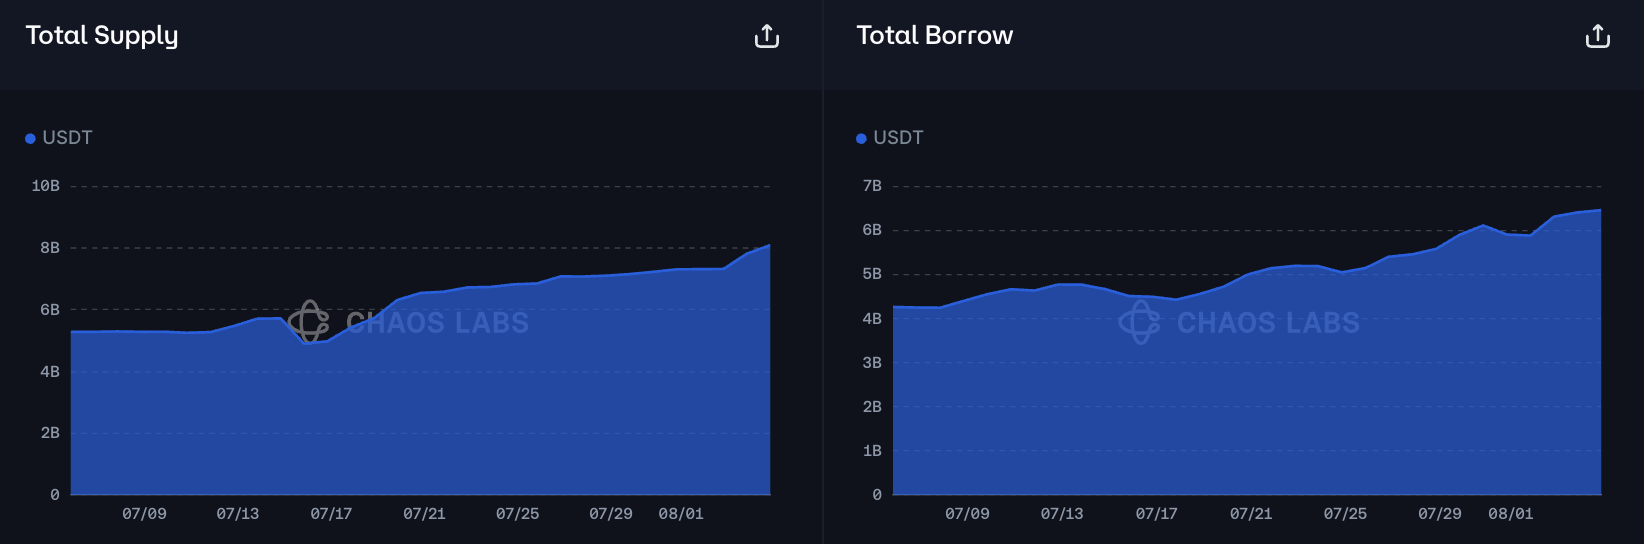
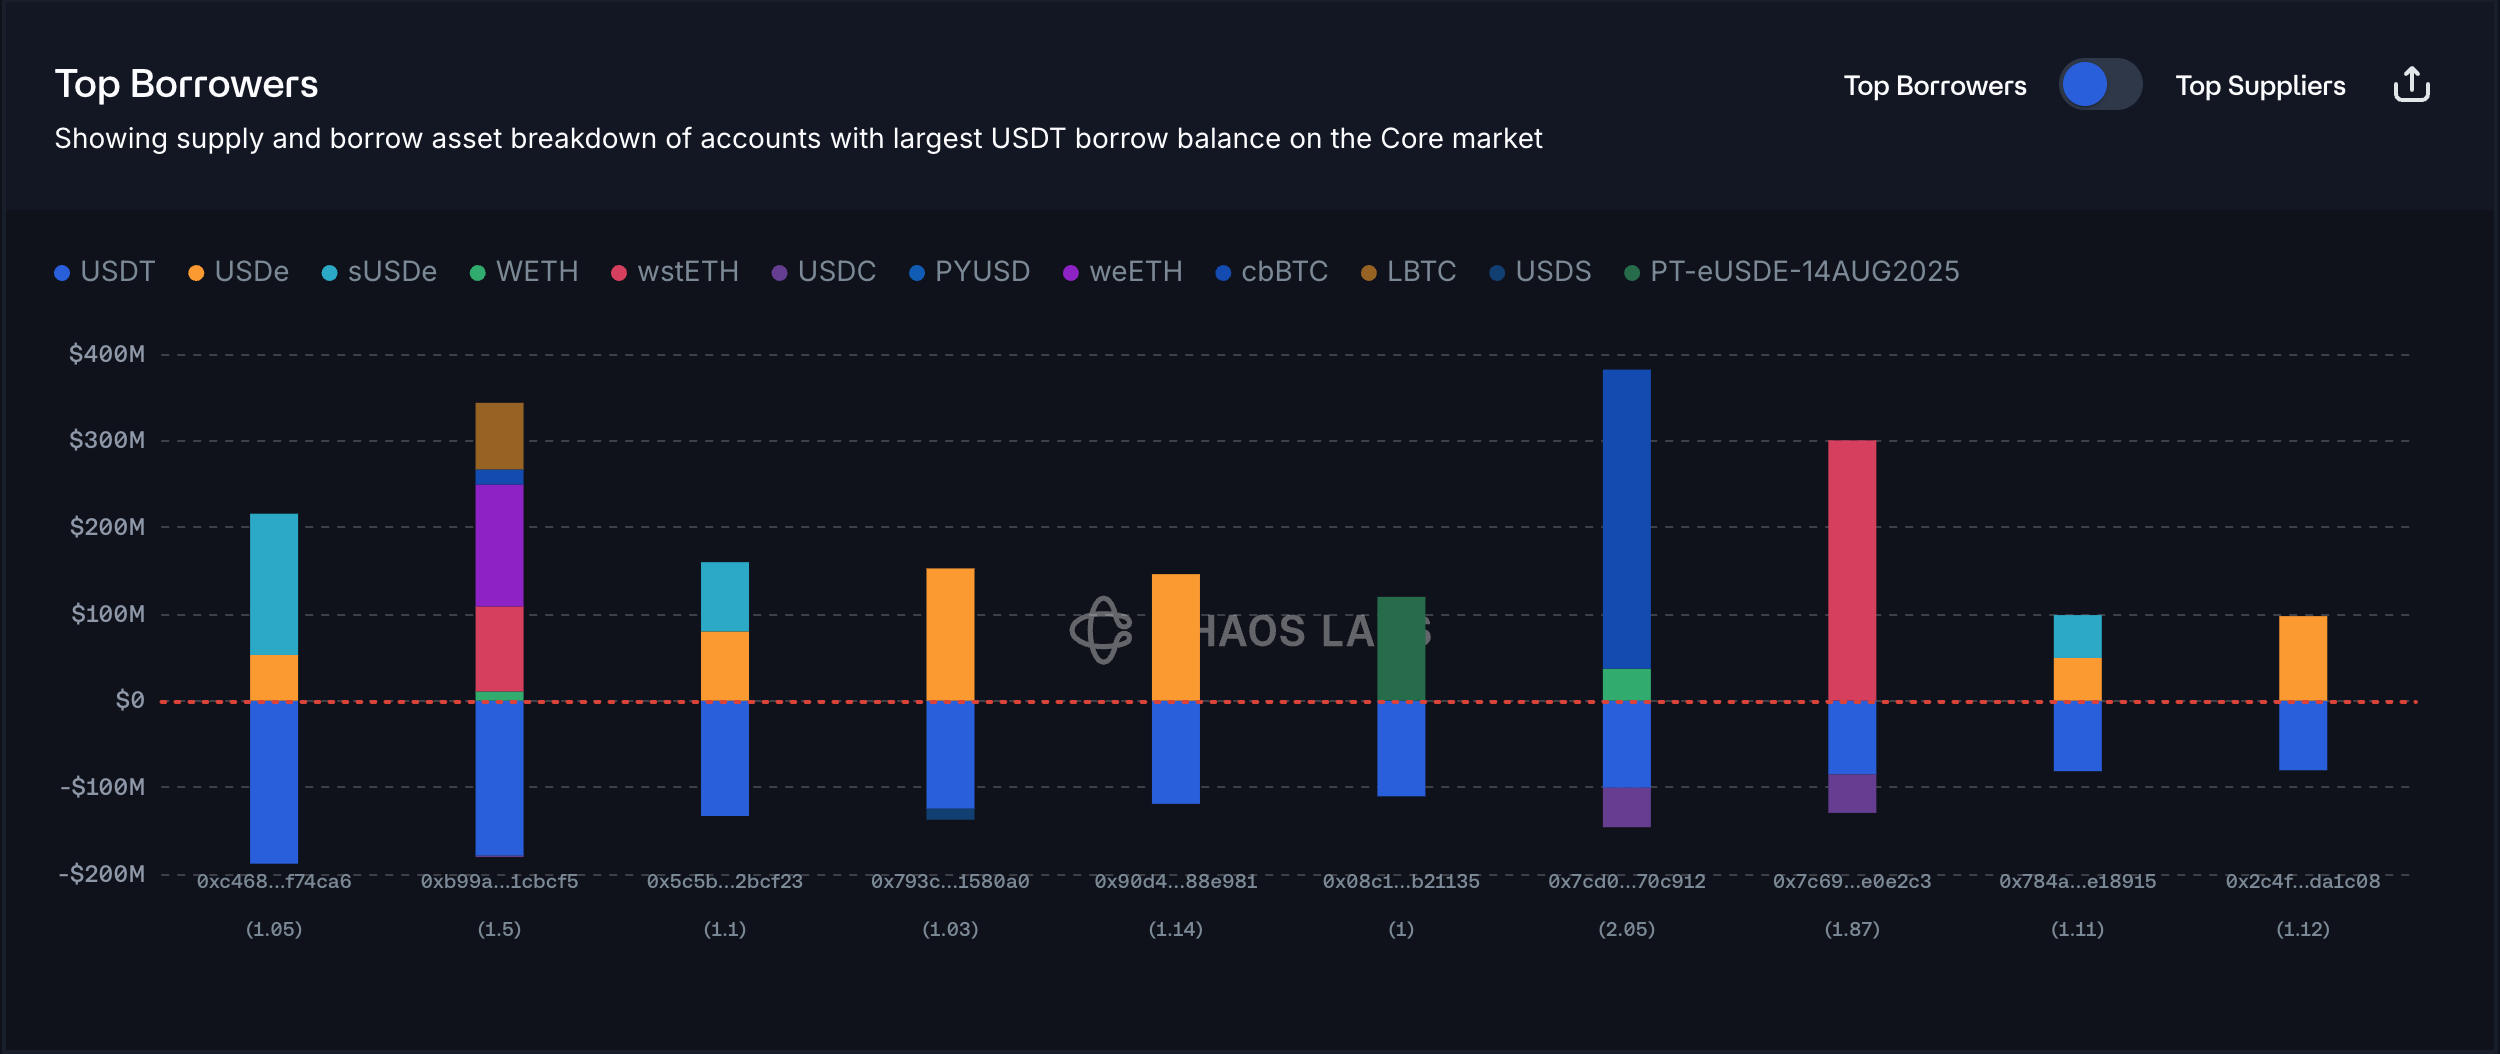
USDT (Ethereum Core)
USDT has reached 95% supply cap utilization following significant new deposits into the market, as well as new borrowing activity.

Supply Distribution
There are two suppliers who each supply over $1.6B USDT. The largest is linked to Justin Sun, while the second is tagged as HTX’s Recovery Wallet. The third largest is related to Ethena. None of the top nine largest suppliers borrow against their position, significantly reducing the risk of large scale liquidations in this market.

Borrow Distribution
The borrow distribution of USDT presents no concentration risk, with the top borrower accounting for less than 5% of the total distribution. At the same time, the top borrowers have either collateralized highly correlated assets such as sUSDe, USDe, and PT-eUSDe, or maintain very high health scores, which significantly reduces the risk of liquidation.
Recommendation
Given the user behavior, we recommend increasing USDT’s supply and borrow caps.
sUSDe (Ethereum Core)
sUSDe’s supply cap utilization has reached 92%, rising from 150M to 1B within a week, indicating strong user demand.


Supply Distribution
The supply distribution of sUSDe is slightly concentrated, with the top supplier accounting for 17% of the total distribution. However, since this user is borrowing USDT, we believe the risk of liquidation is limited. All the top suppliers are borrowing USDT, USDC, or USDS, which are correlated assets. This significantly reduces the likelihood of liquidation.
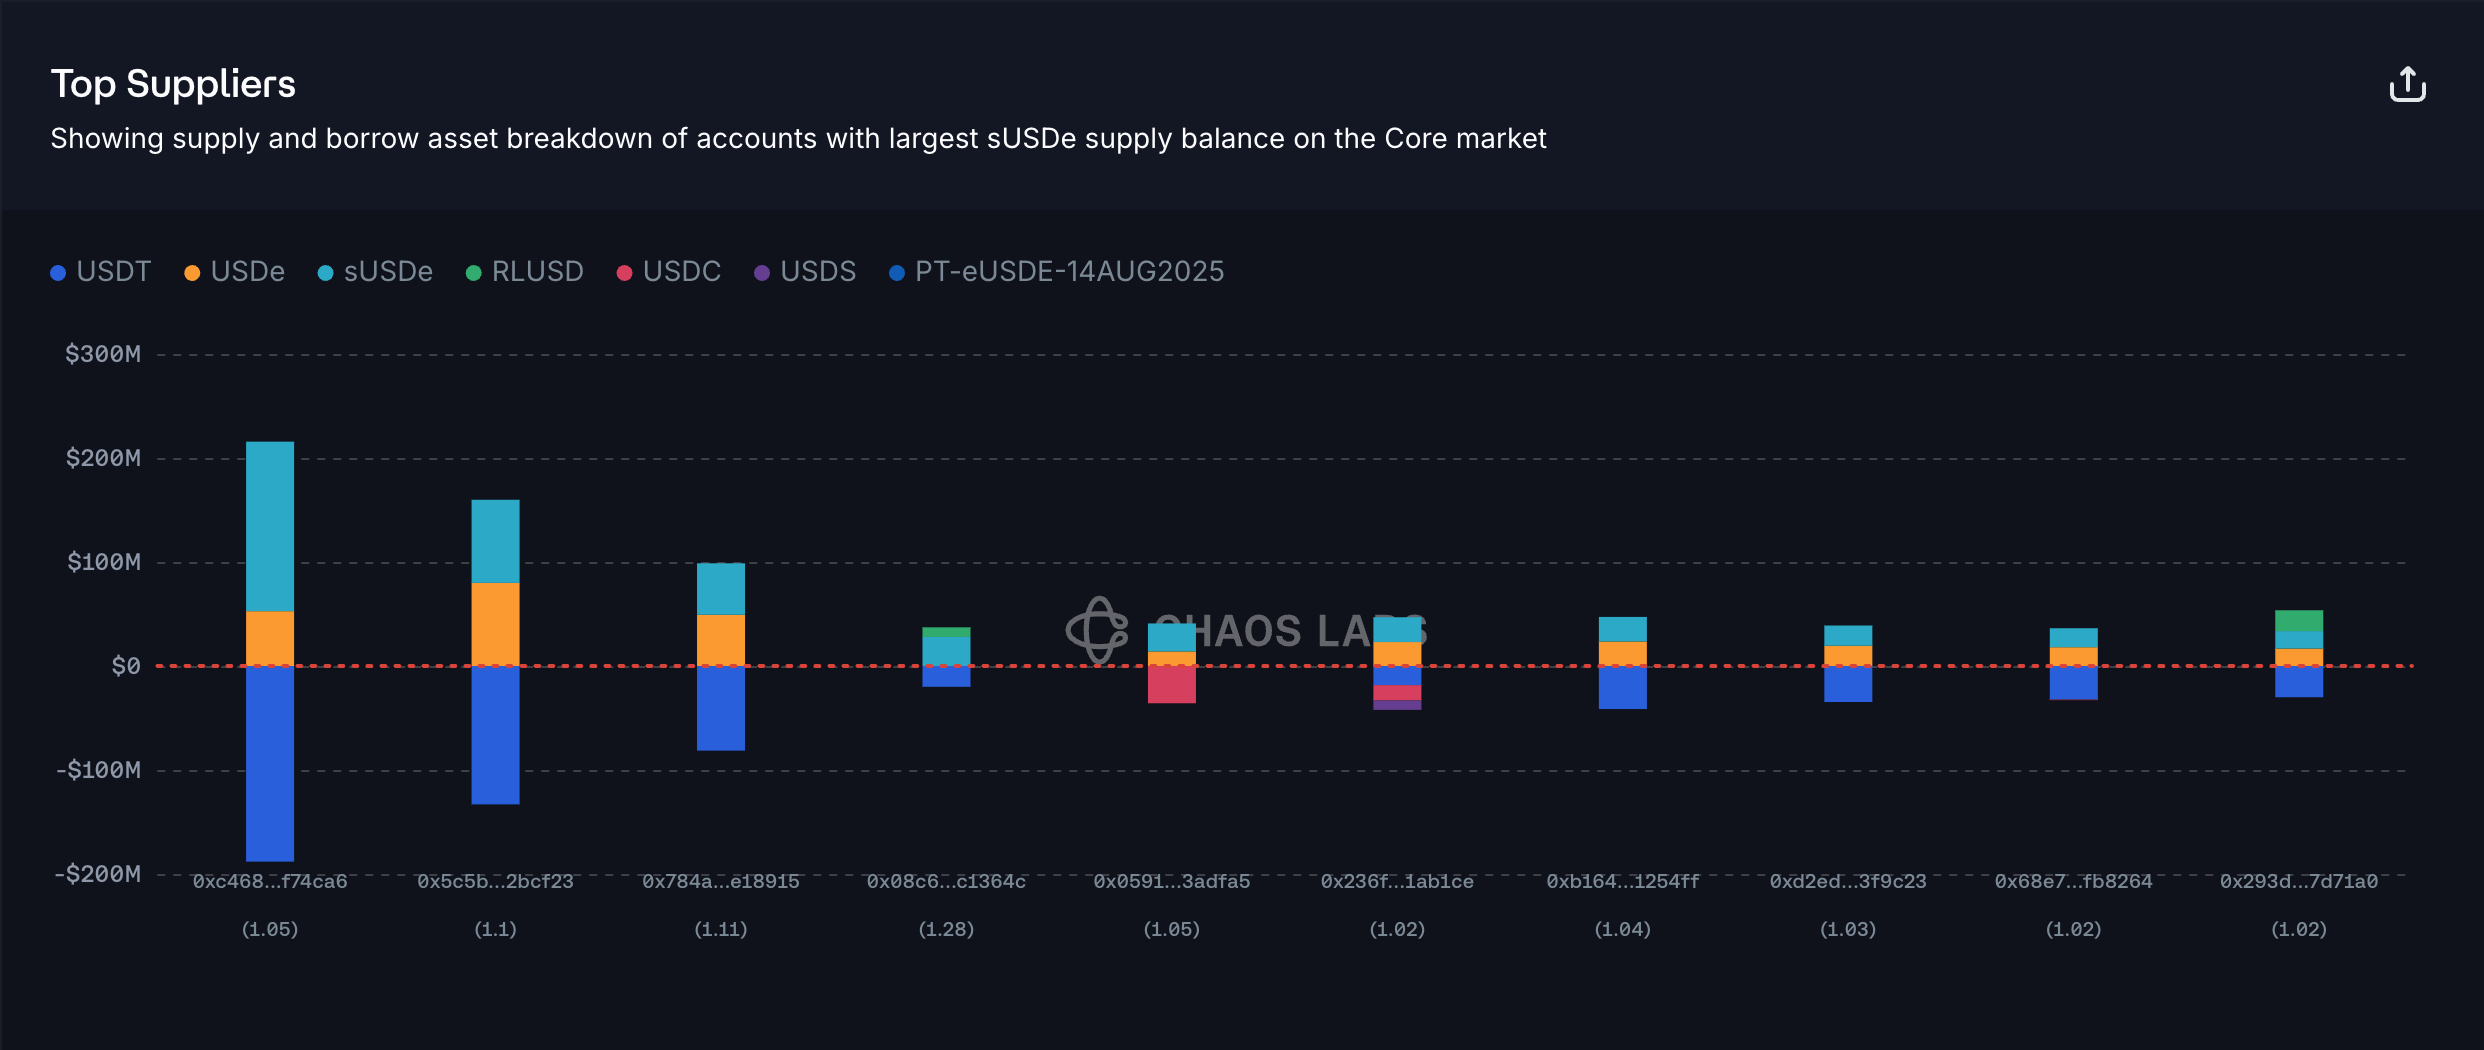
Liquidity
Currently, selling 60M sUSDe for USDT incurs less than 1% price slippage, supporting a supply cap increase.
Recommendation
Given user behavior, on-chain liquidity, and strong demand, we recommend increasing sUSDe’s supply cap.
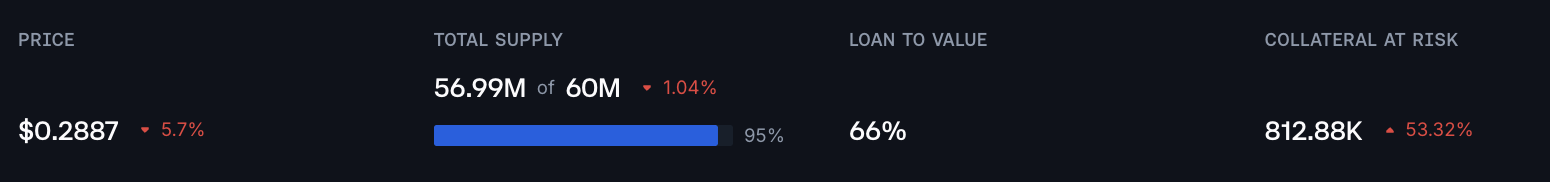
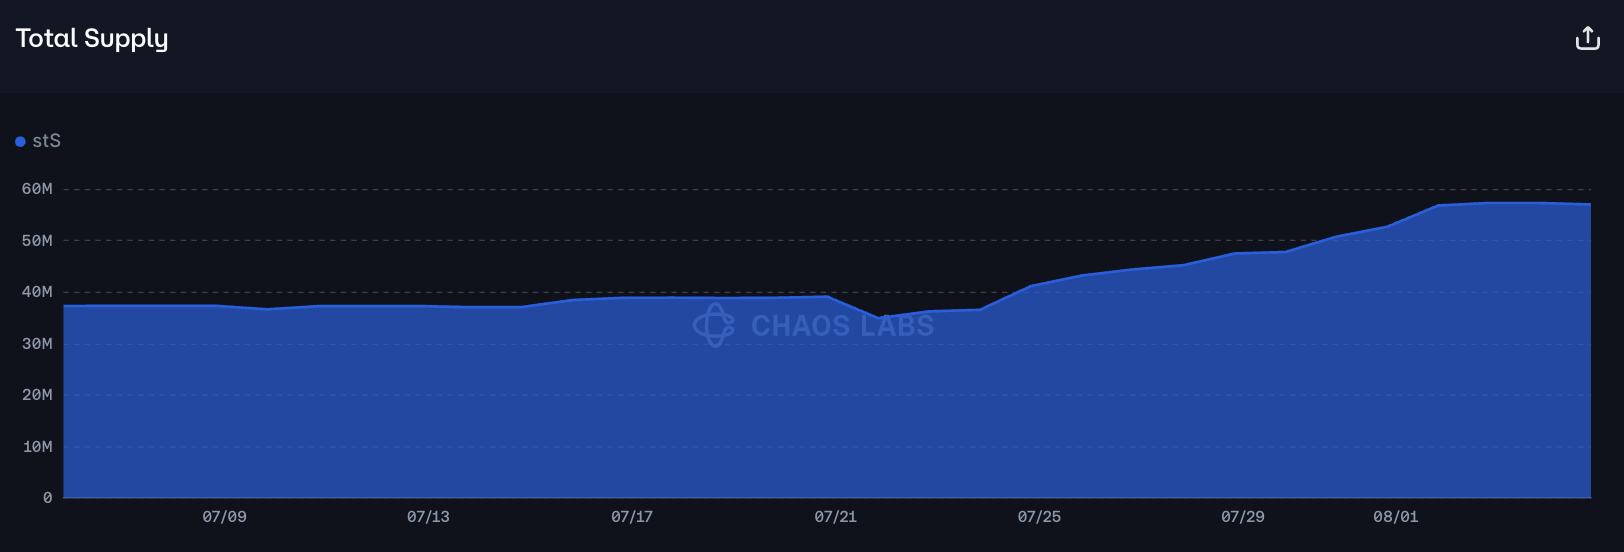
stS (Sonic)
stS has reached 95% supply cap utilization following new deposits in the market.
Supply Distribution
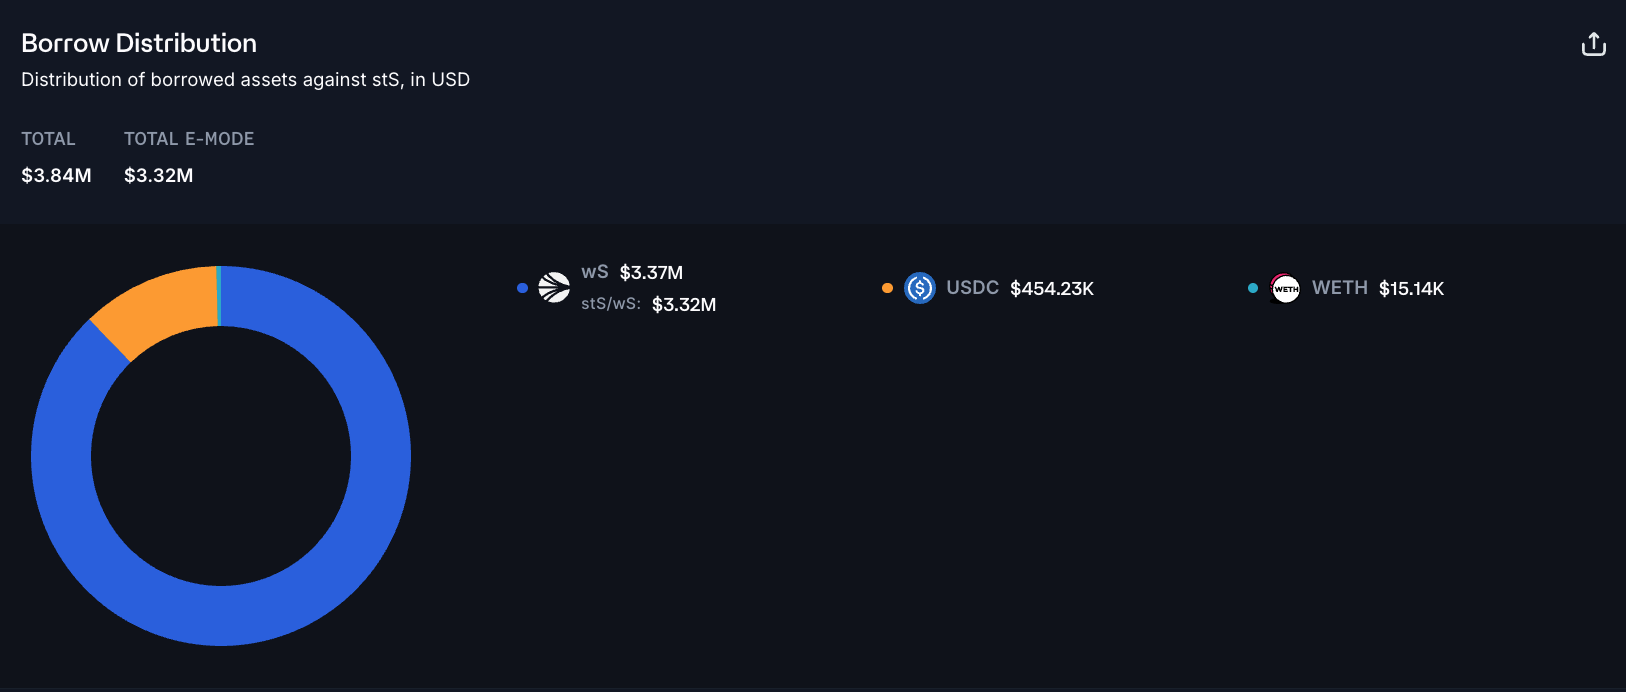
Supply is not heavily concentrated, and all but one of the top 10 suppliers are using stS to borrow wS, presenting very little risk of liquidation because of the assets’ correlation.
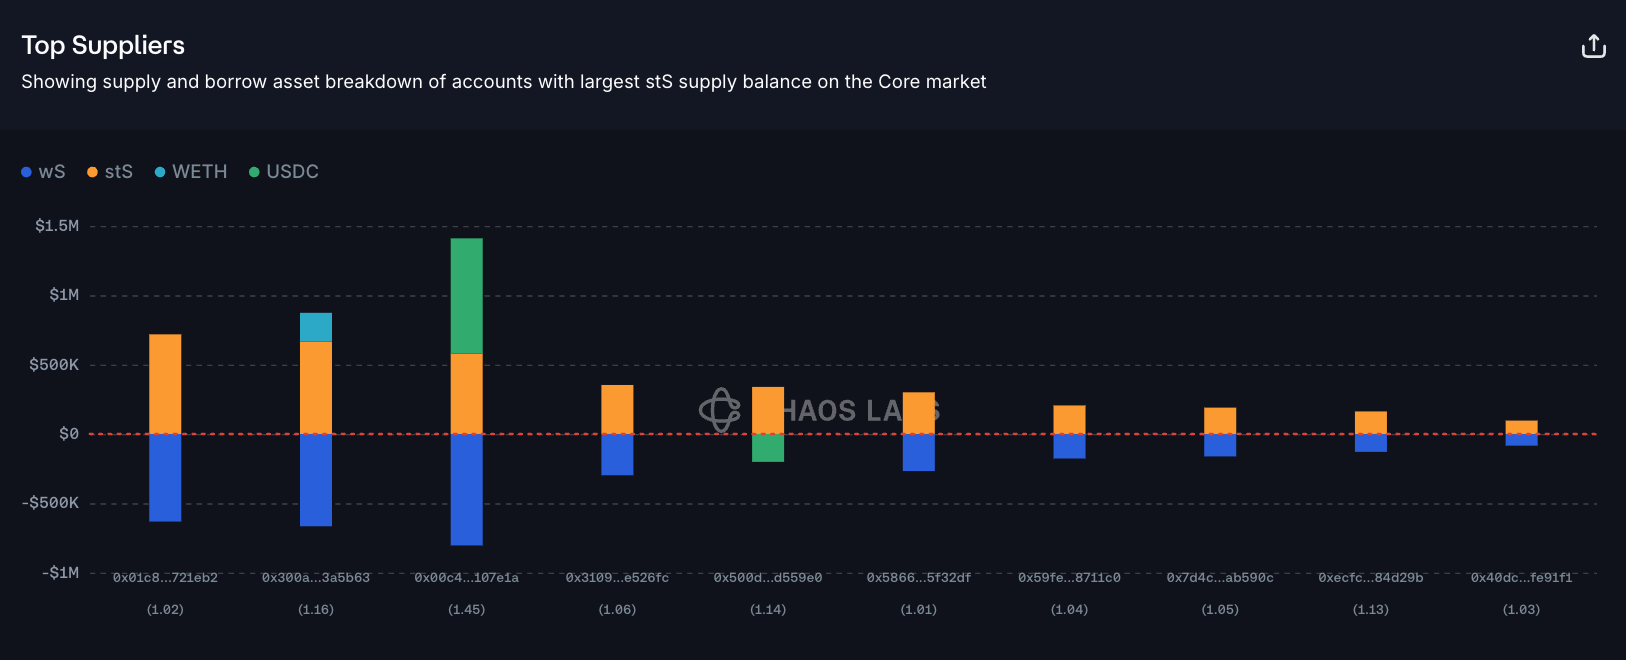
Overall, stS is primarily used to borrow wS, though it is being used to borrow $454K USDC, which presents some risk of liquidation should stS’s price fall.
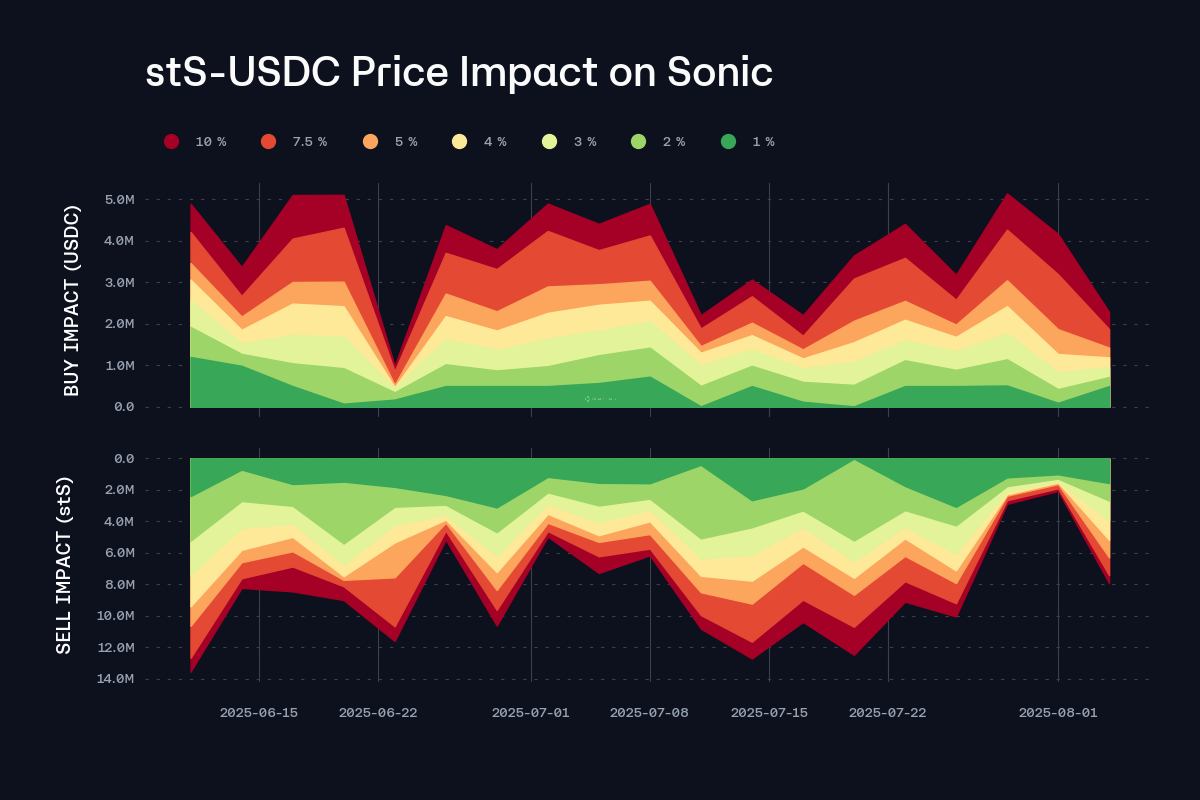
Liquidity
stS’s liquidity has been somewhat volatile in recent weeks, though currently an 8M stS for USDC swap can be completed at less than 10% price slippage.
Recommendation
Considering the asset’s primary use case — for leveraged yield farming — and its liquidity, we recommend increasing its supply cap.
PT-USDe-31JUL2025 and PT-sUSDE-31JUL2025
We recommend reducing the supply caps for recently expired PT tokens to 1.
Specification
Disclaimer
Chaos Labs has not been compensated by any third party for publishing this research paper. Our pre-launch risk reports on Ethena, published over a year ago, represented a temporary compensated engagement, bear no implications on the current state of the protocol and can be viewed here on our website. We additionally provide proof-of-reserve attestations for the Ethena Protocol, which periodically reflect the aggregate state of the portfolio relative to the underlying USDe shares emitted.